Plot + Scatter logo

+ Portfolio

For nearly a decade, we’ve been delivering dynamic, compelling data experiences. See the results.

Changing Coastlines

UBC SALA

Changing Coastlines

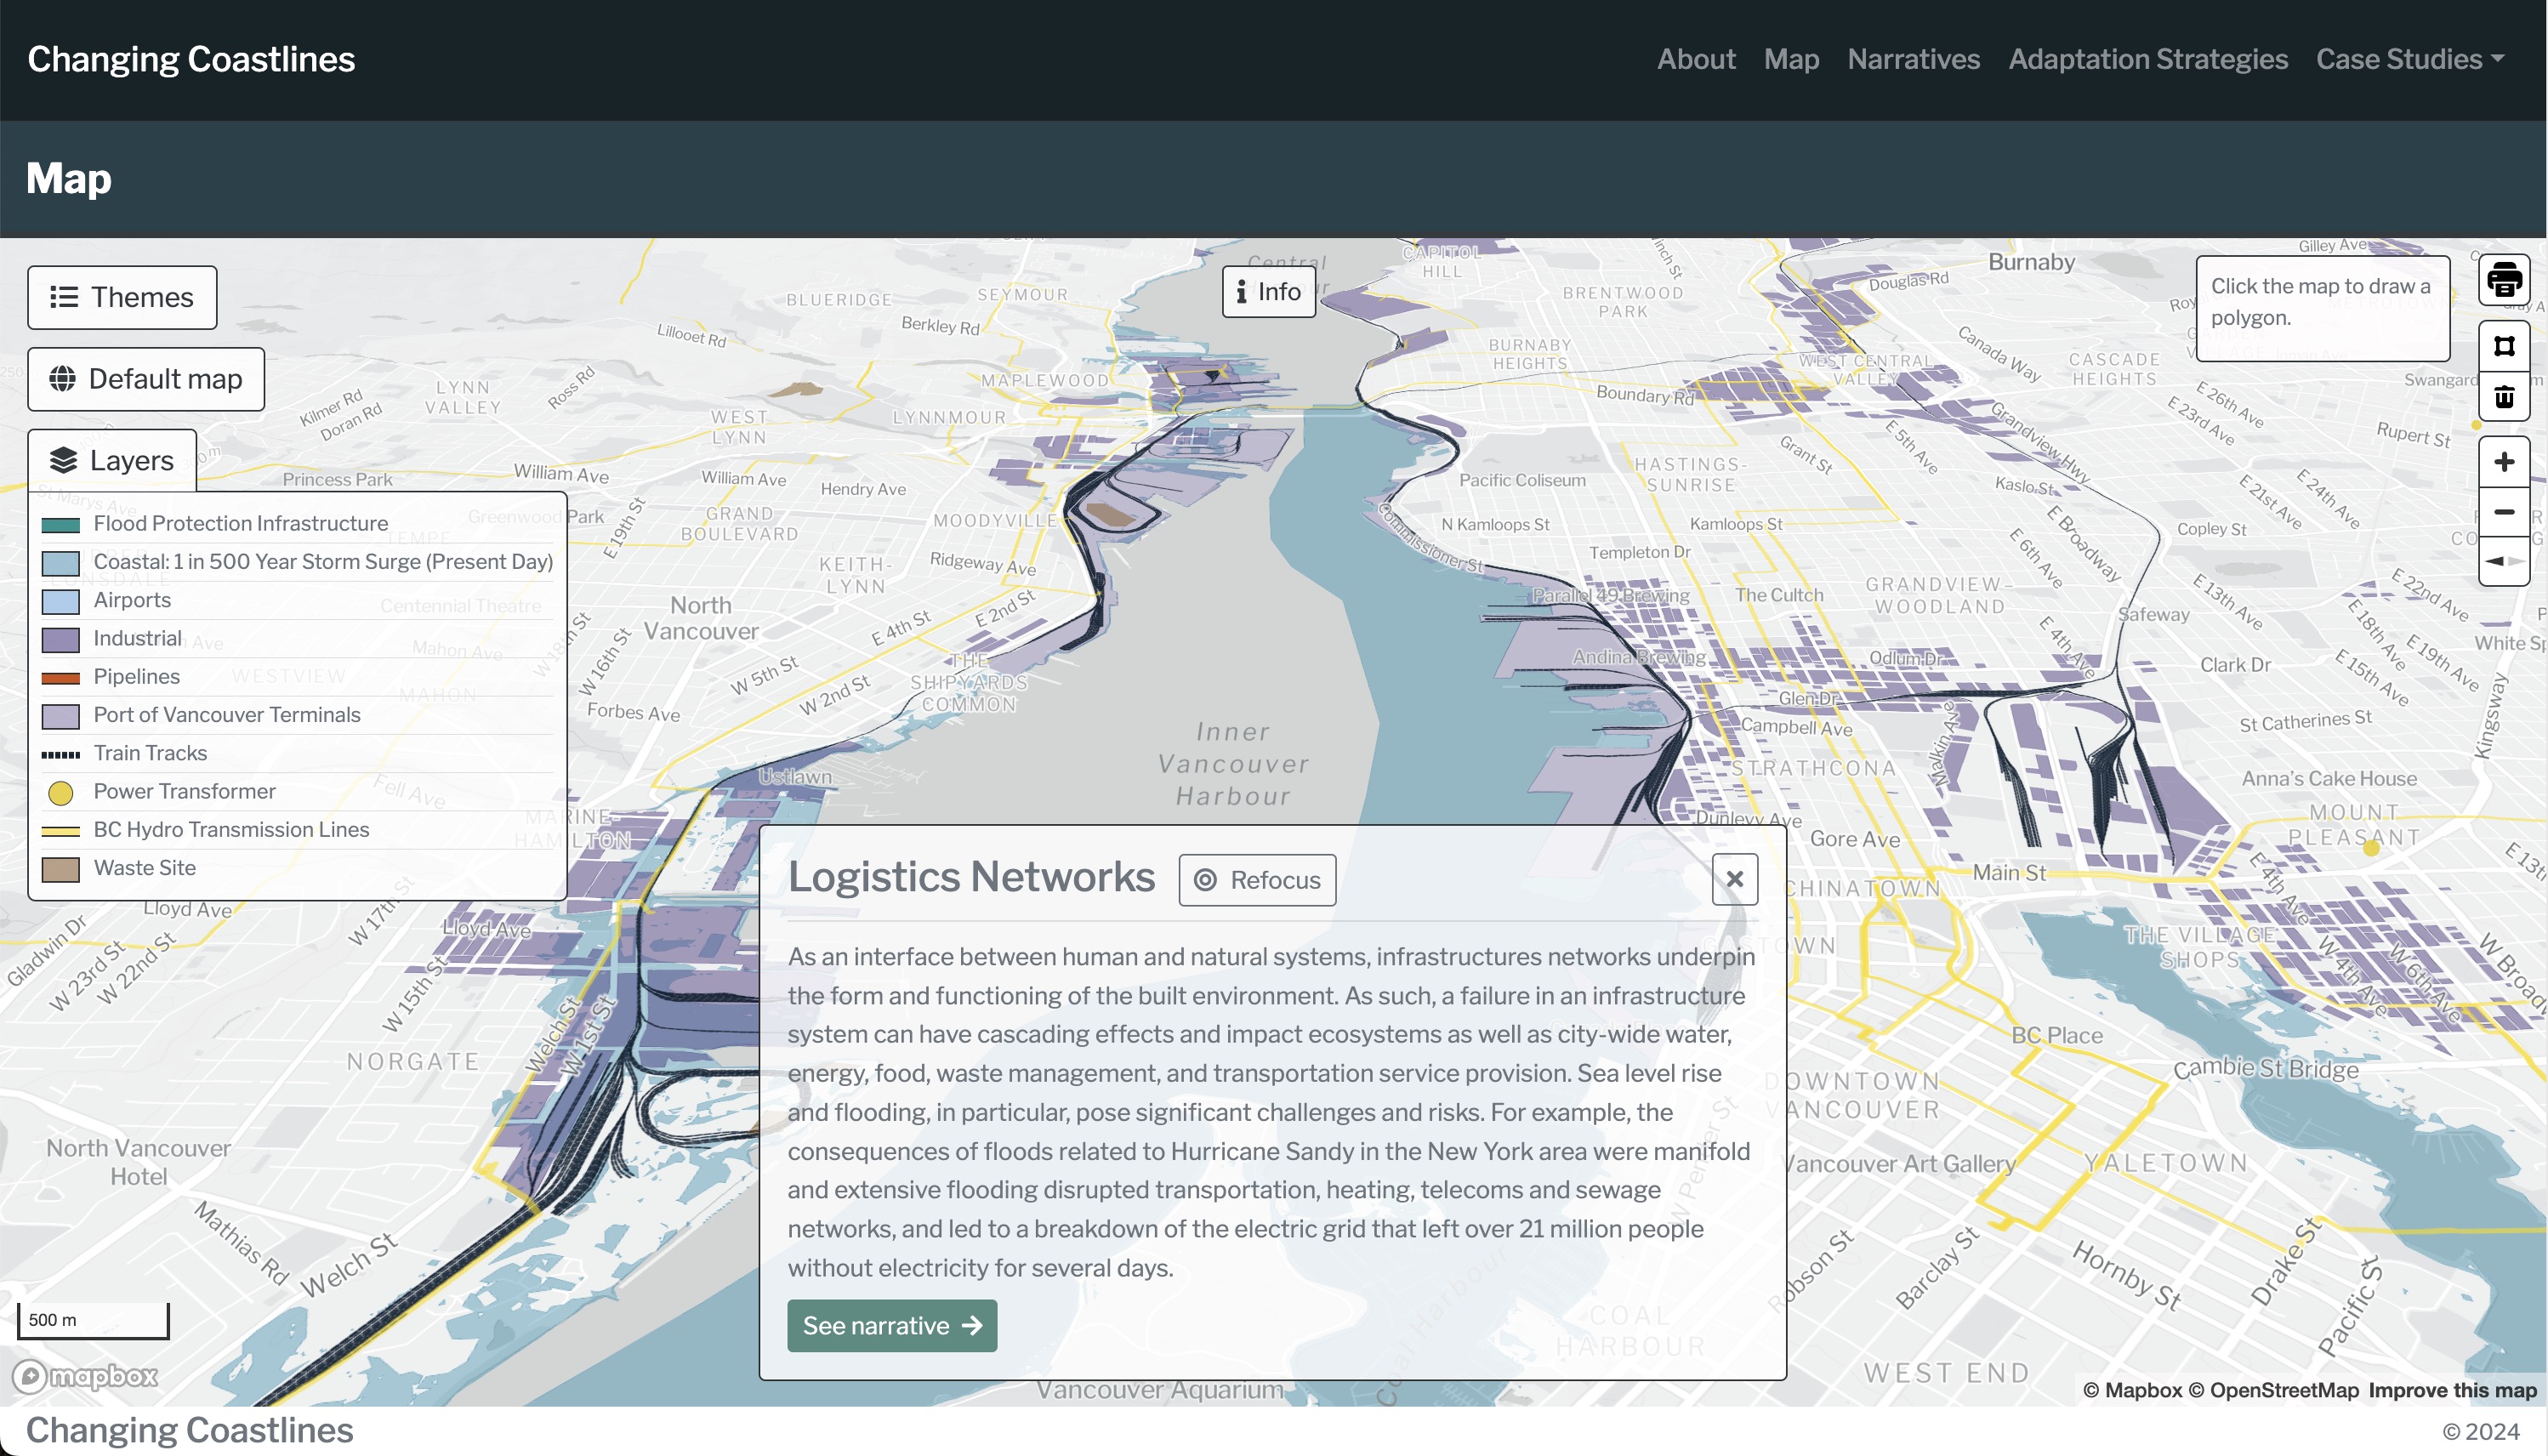
Interactive mapping and data viz elements for the Changing Coastlines project.

Charting
Development
Mapping
Visual design

Technologies

AWS
Gatsby
Mapbox
React
Squarespace

Benchmetrics

Benchmetrics View in new tab

Benchmetrics

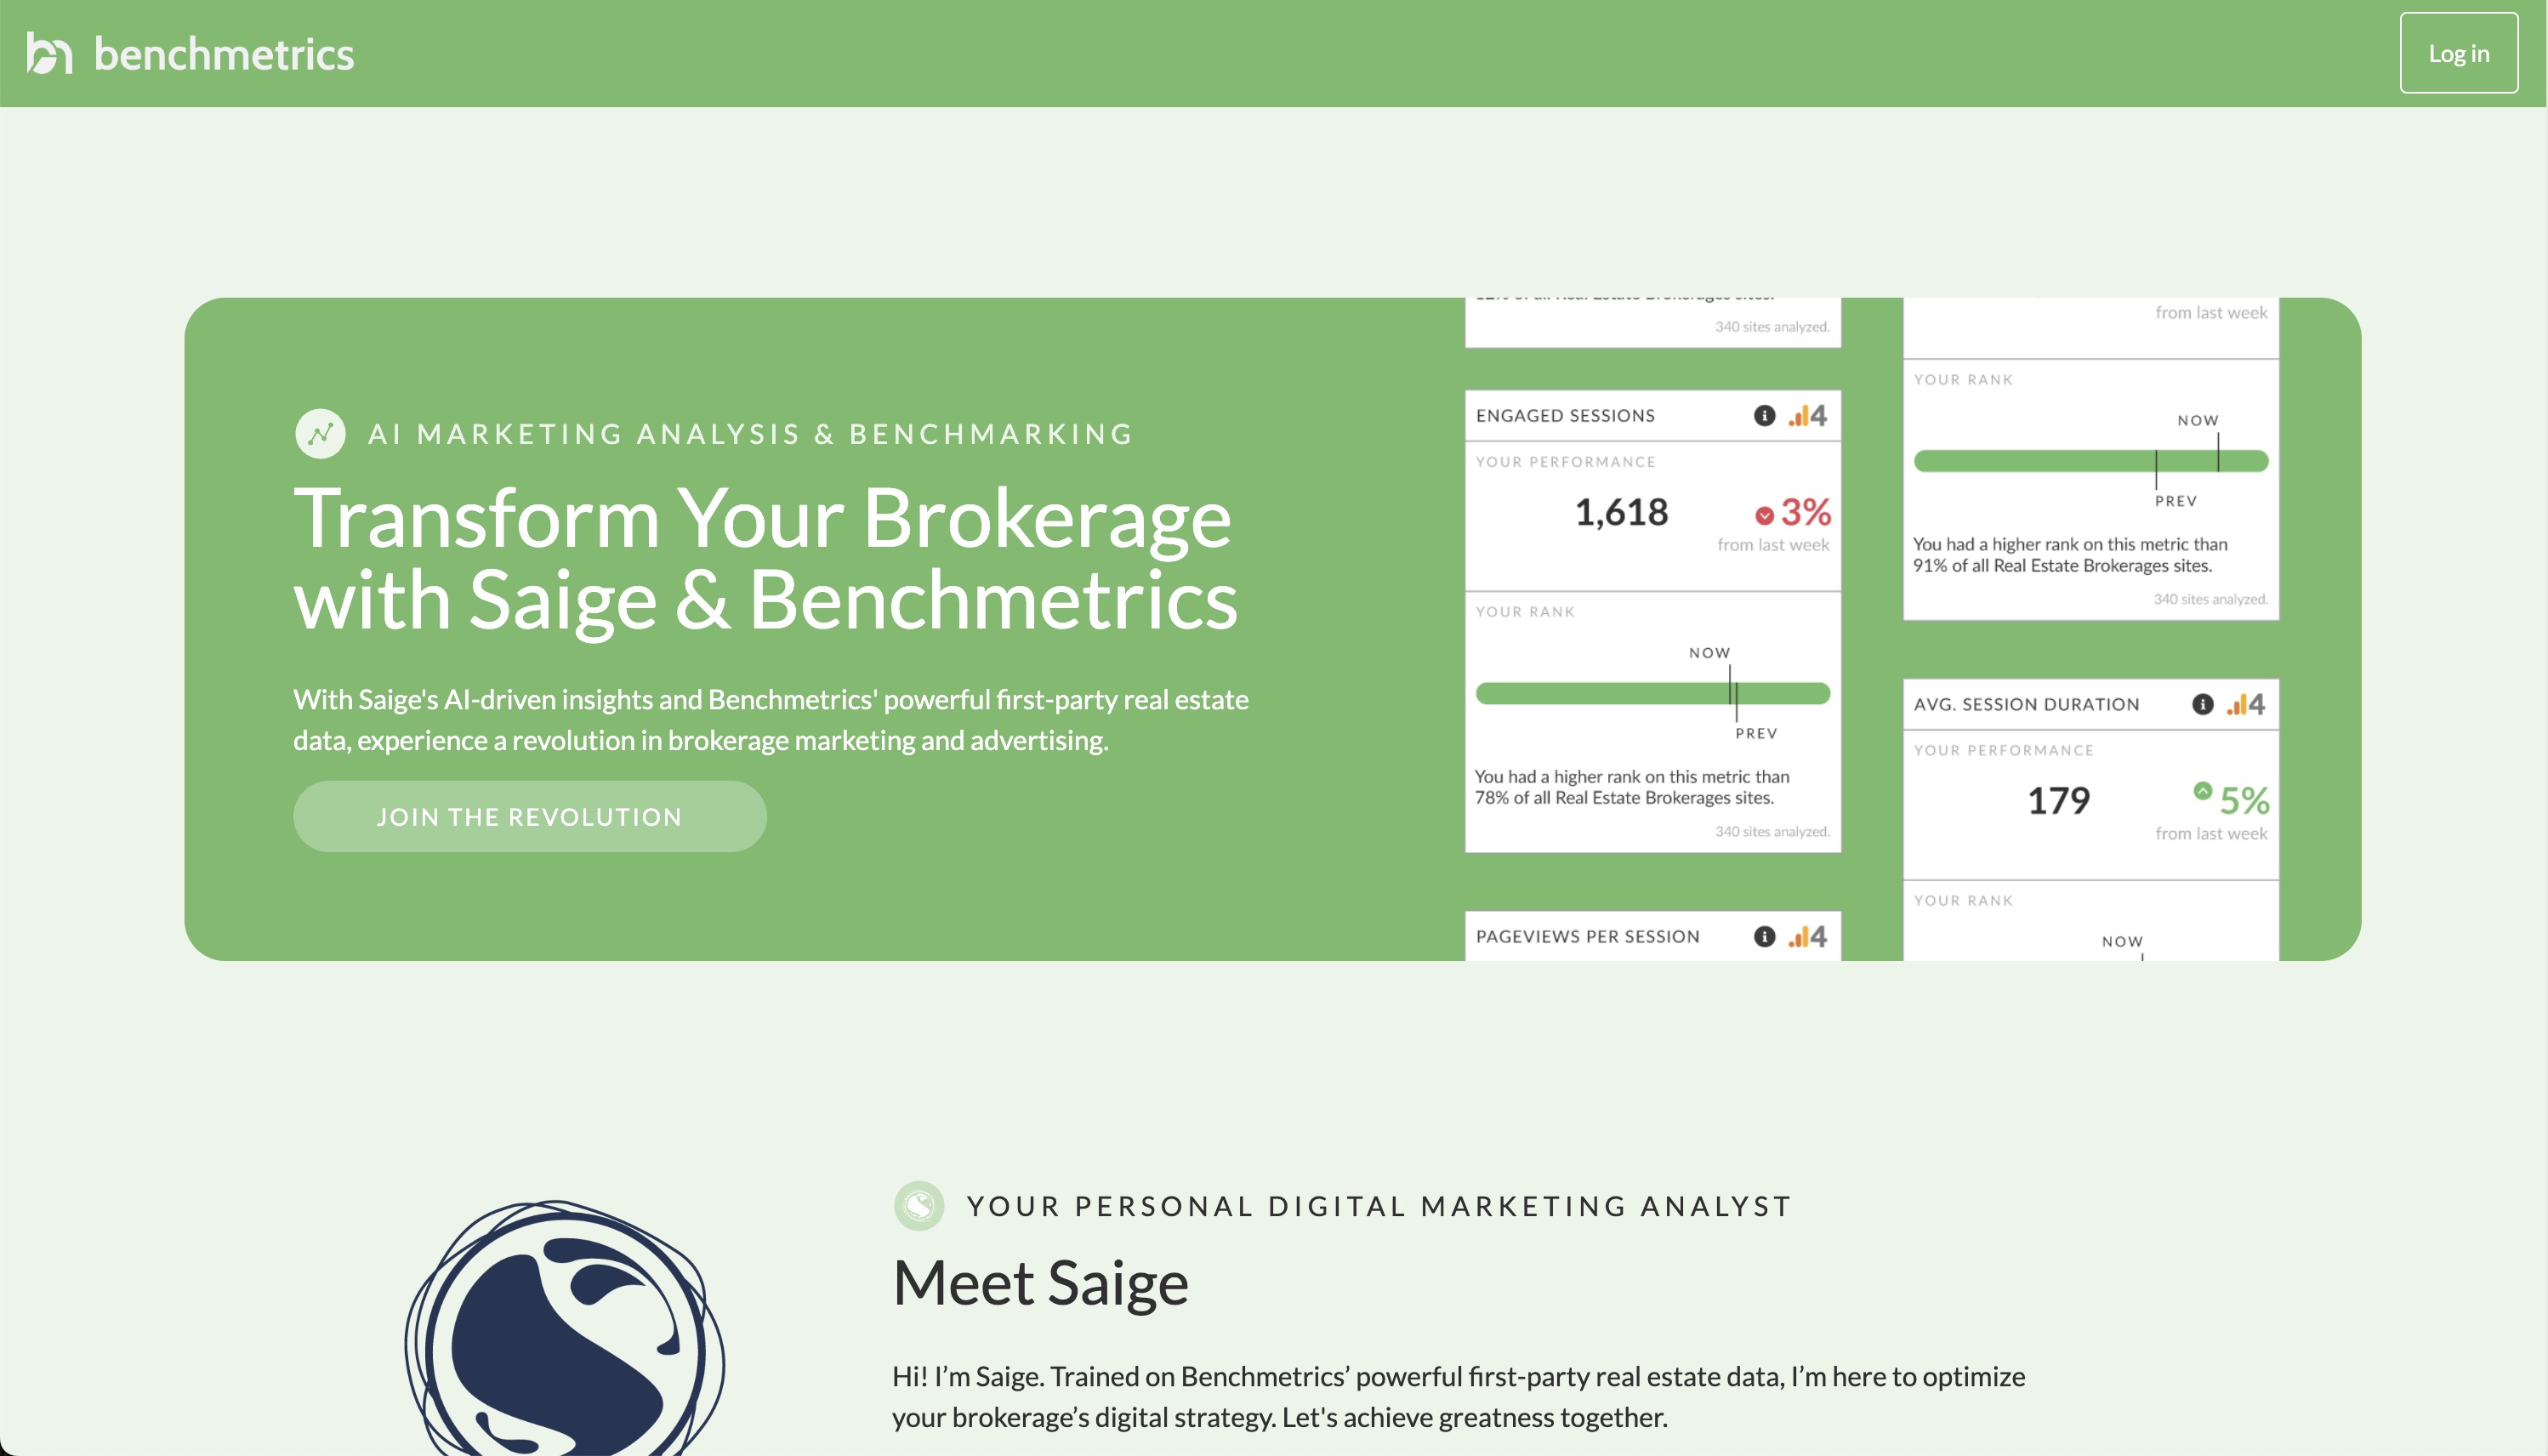
Lead developer on the Benchmetrics real estate brokerage analytics and benchmarking tool, including data model and API design.

API design
Analysis
Charting
Data wrangling
Development
Visual design

Technologies

AWS
Cloudflare
MongoDB
React
Remix

Intuition Commons

Christine d’Onofrio View in new tab

Intuition Commons

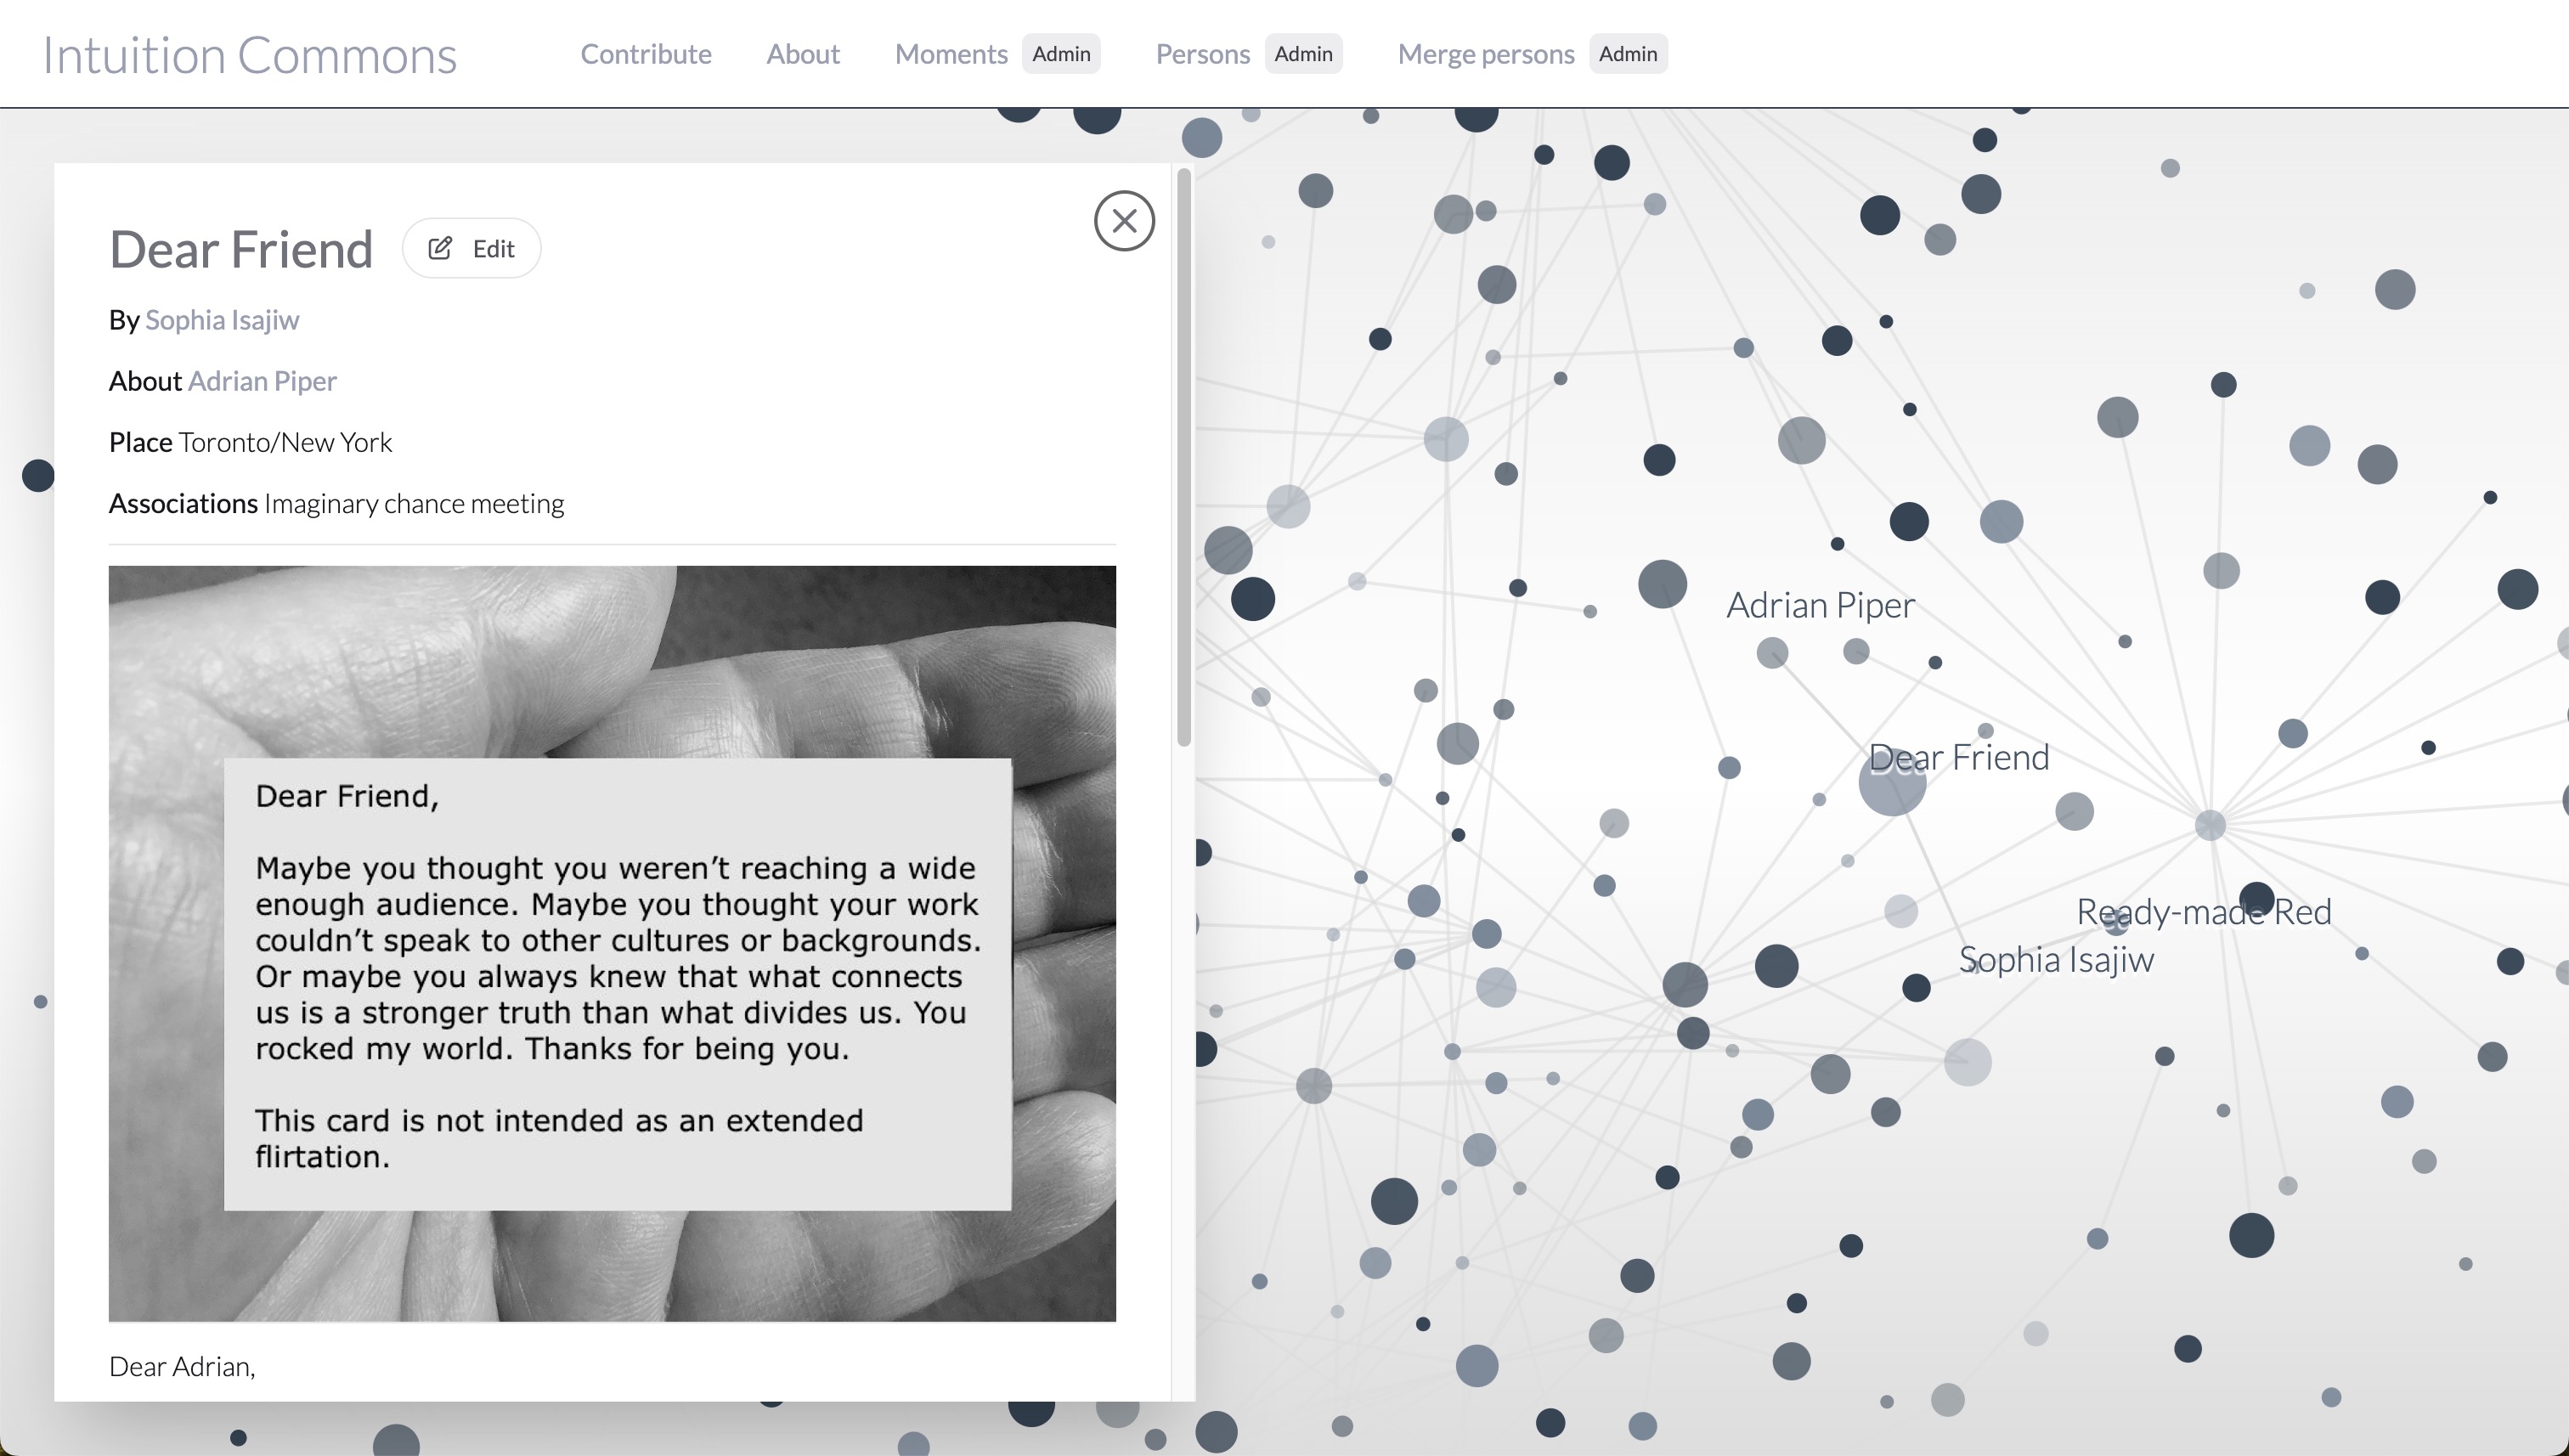
Led implementation on Intuition Commons, a project by the artist Christine d’Onofrio showcasing the connections of influence between women artists. Nominated for the Vancouver UX Awards.

Charting
Data wrangling
Development
Visual design

Technologies

AWS
Cloudflare
Hasura
React
Remix

Small Business Dashboards

Various clients, Victoria area

Small Business Dashboards

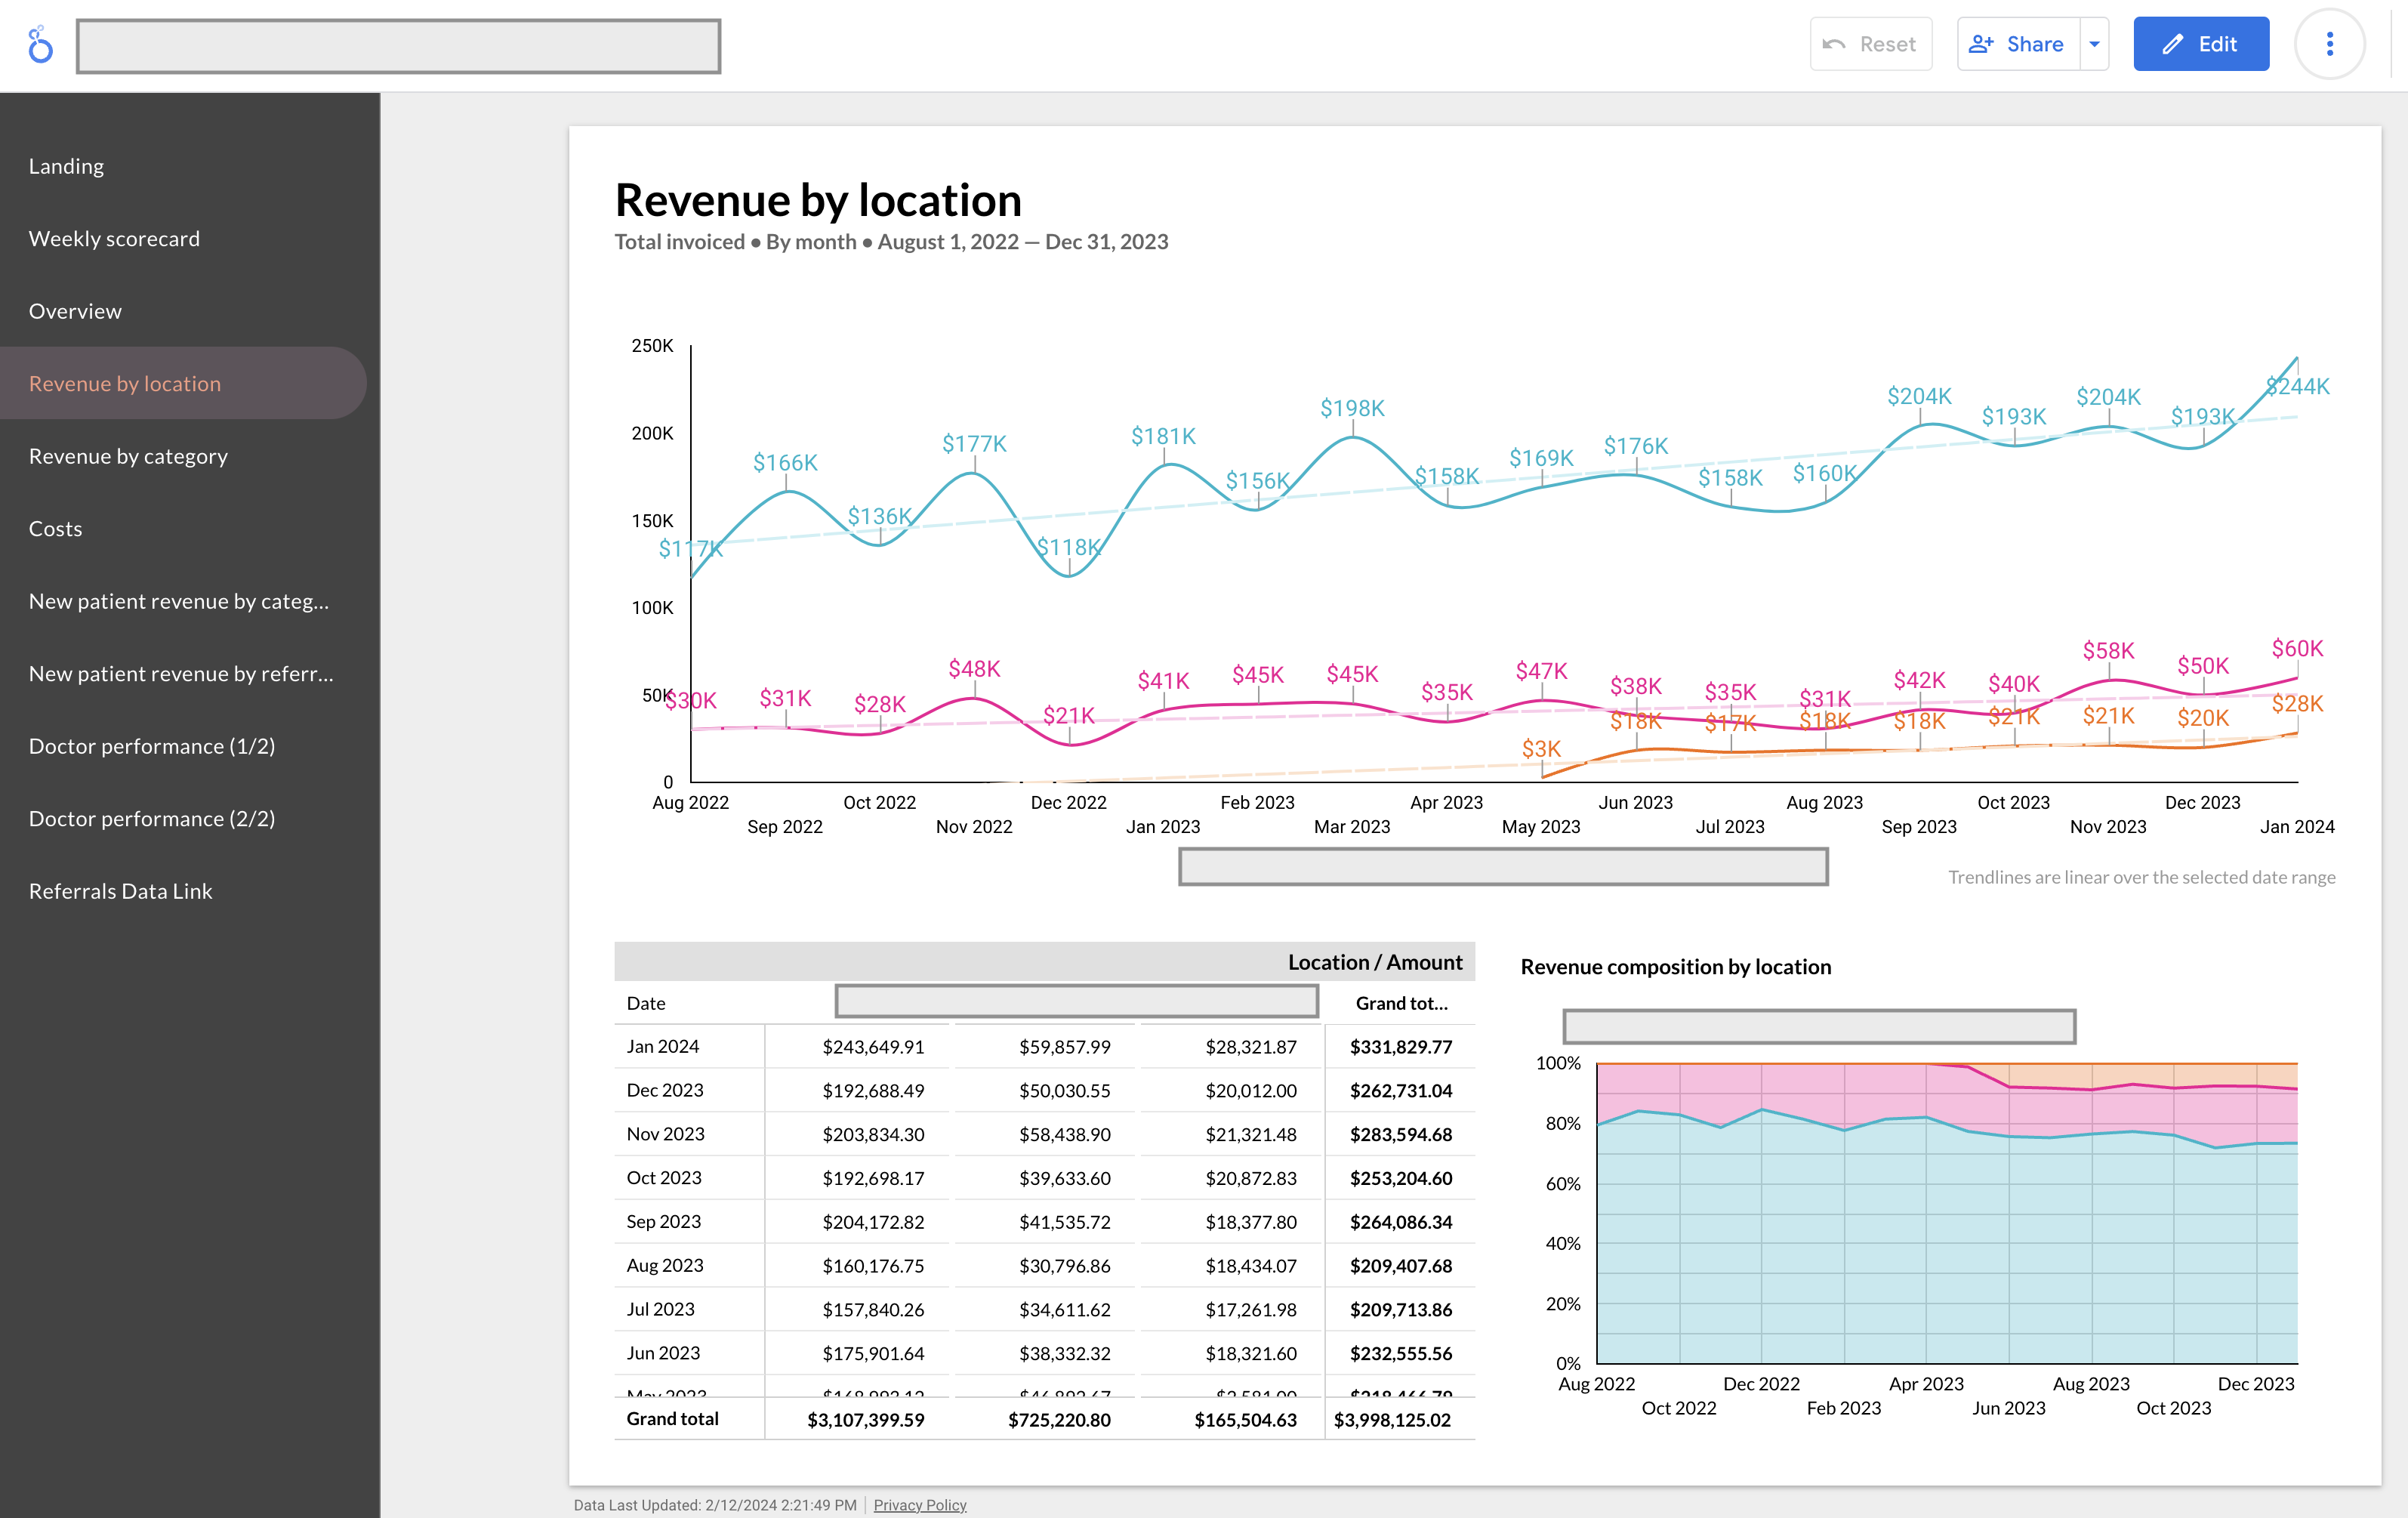
Bespoke dashboards in Looker Data Studio for small business KPI reporting, such as revenue, costs, and sales.

Analysis
Charting
Data wrangling
Visual design

Technologies

Excel
Looker Data Studio

whalesound.ca Interactive Map

BC Whales View in new tab

whalesound.ca Interactive Map

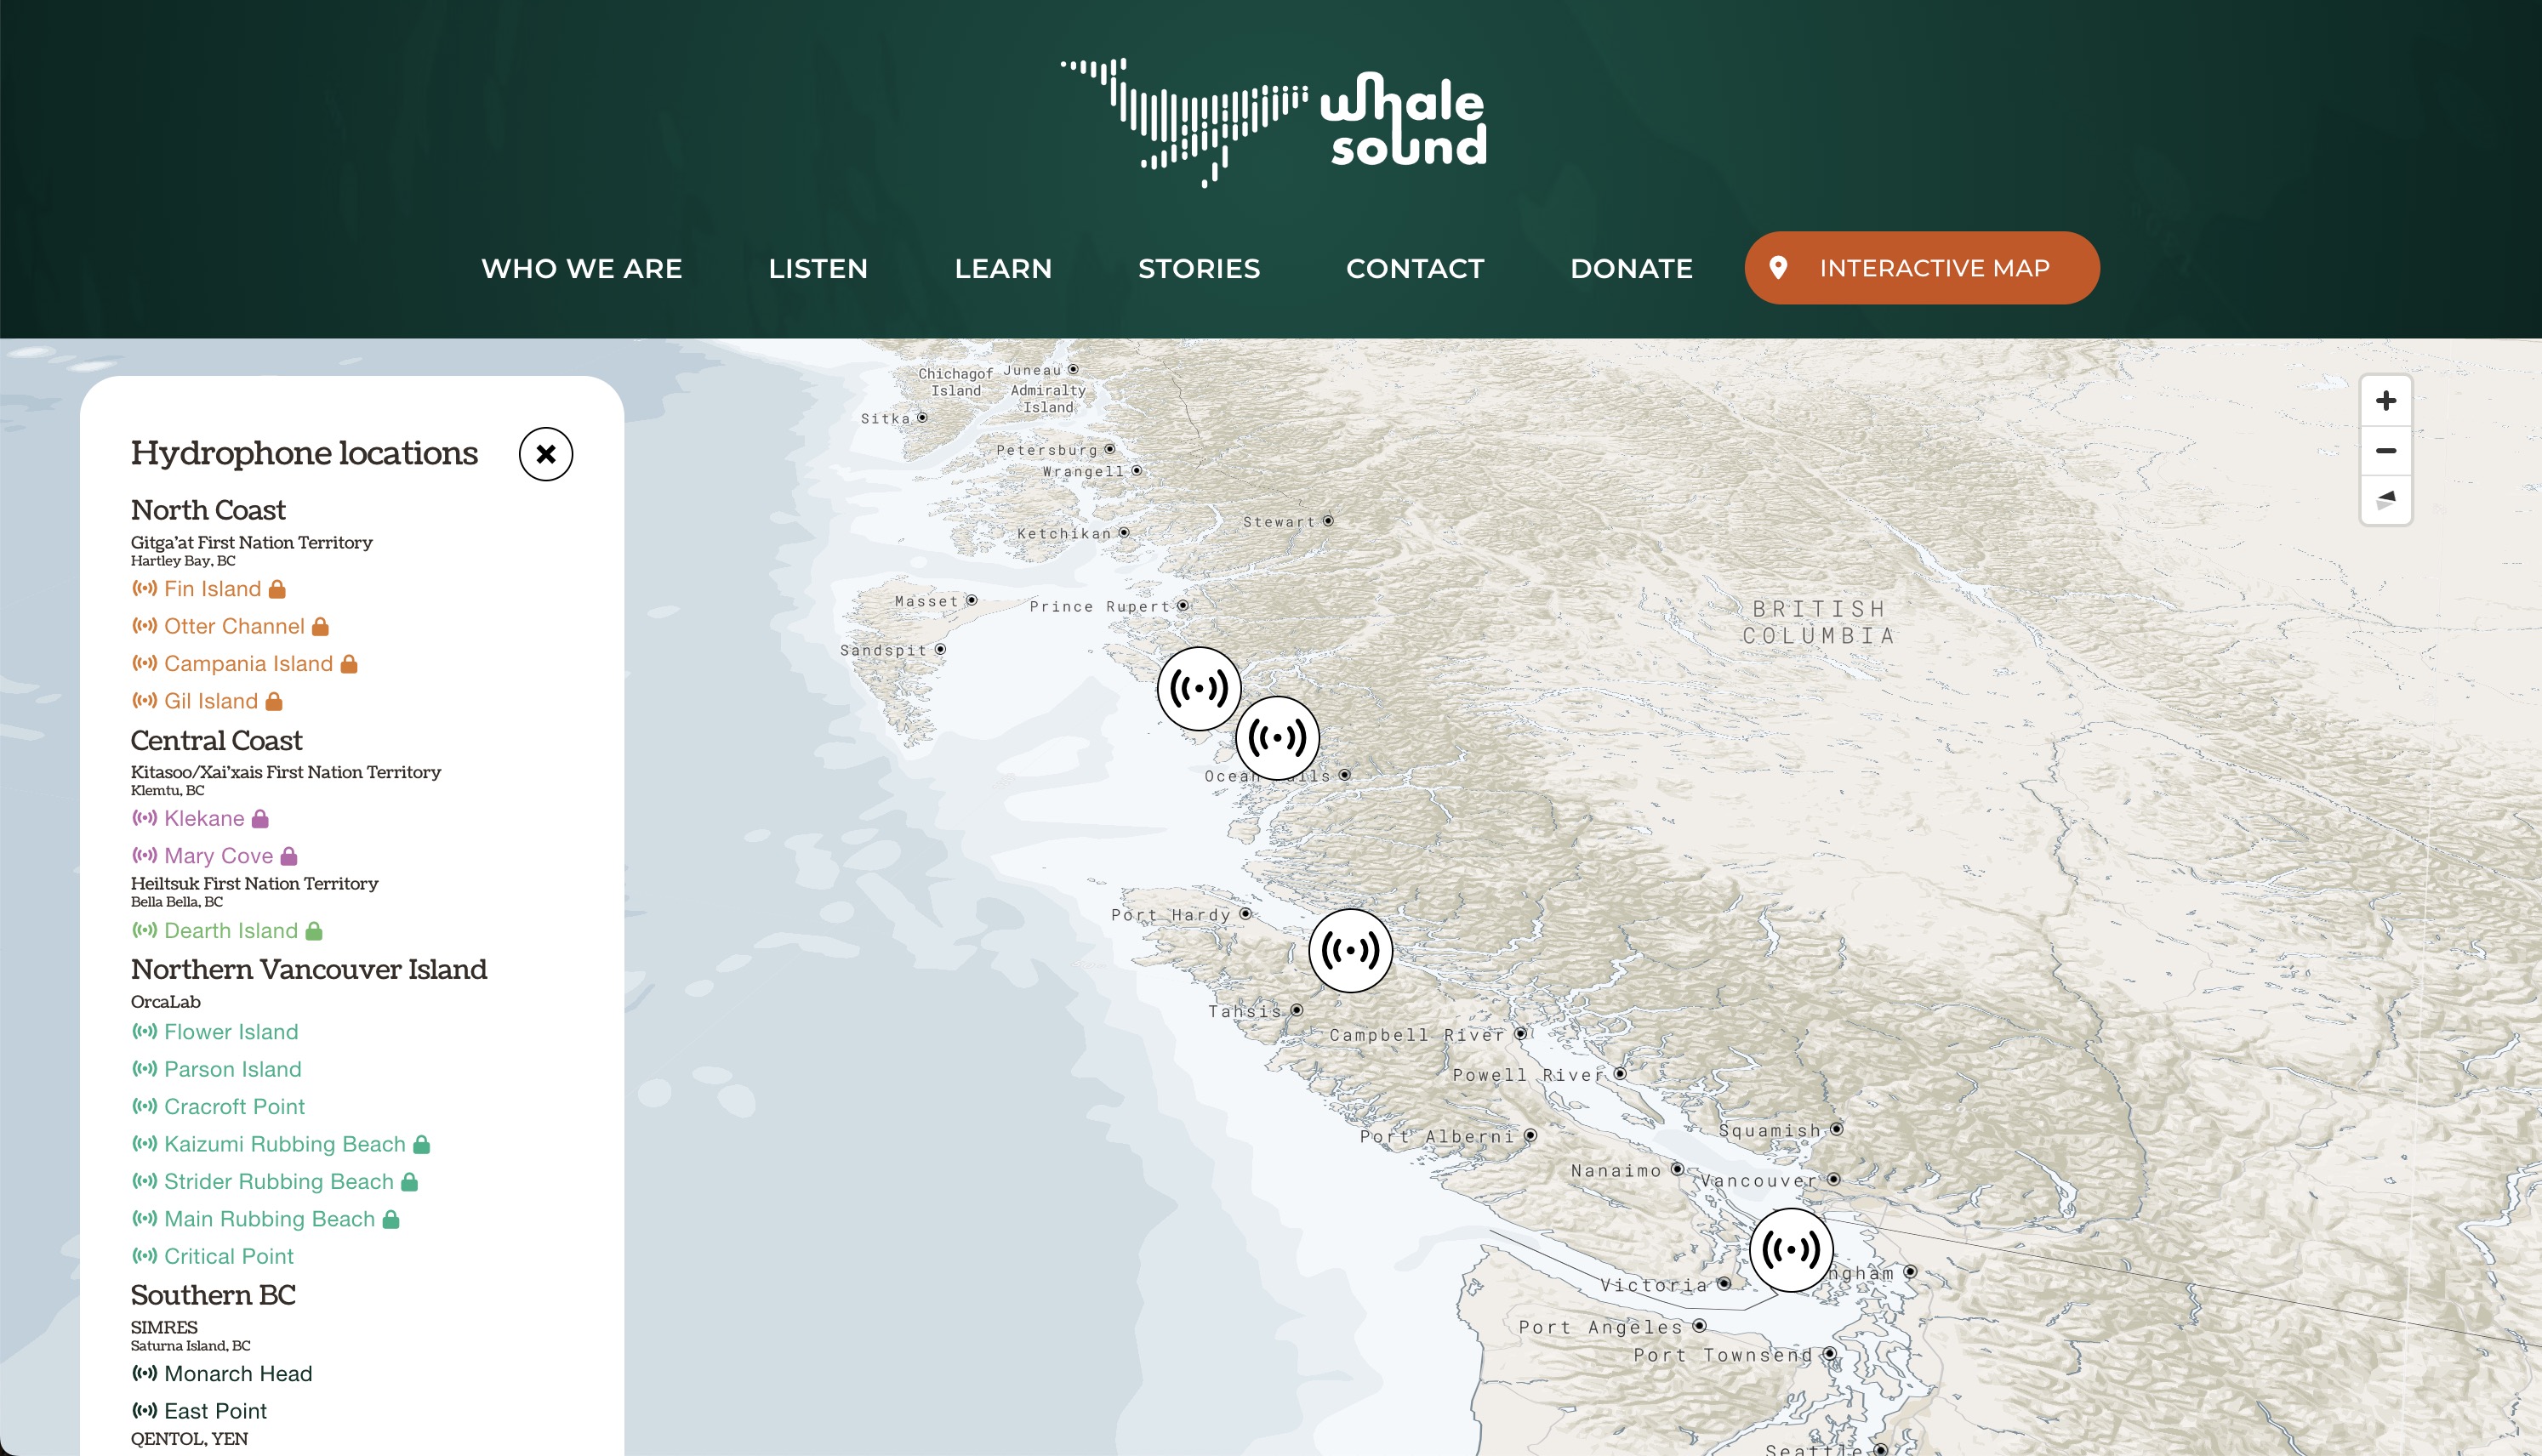
An interactive map of acoustic monitoring stations, tracking whale sounds on the coast of British Columbia.

Data wrangling
Development
Mapping
Visual design

Technologies

Cloudflare
Mapbox
React
Vite

DCHP-3

Stefan Dollinger, UBC Department of English

DCHP-3

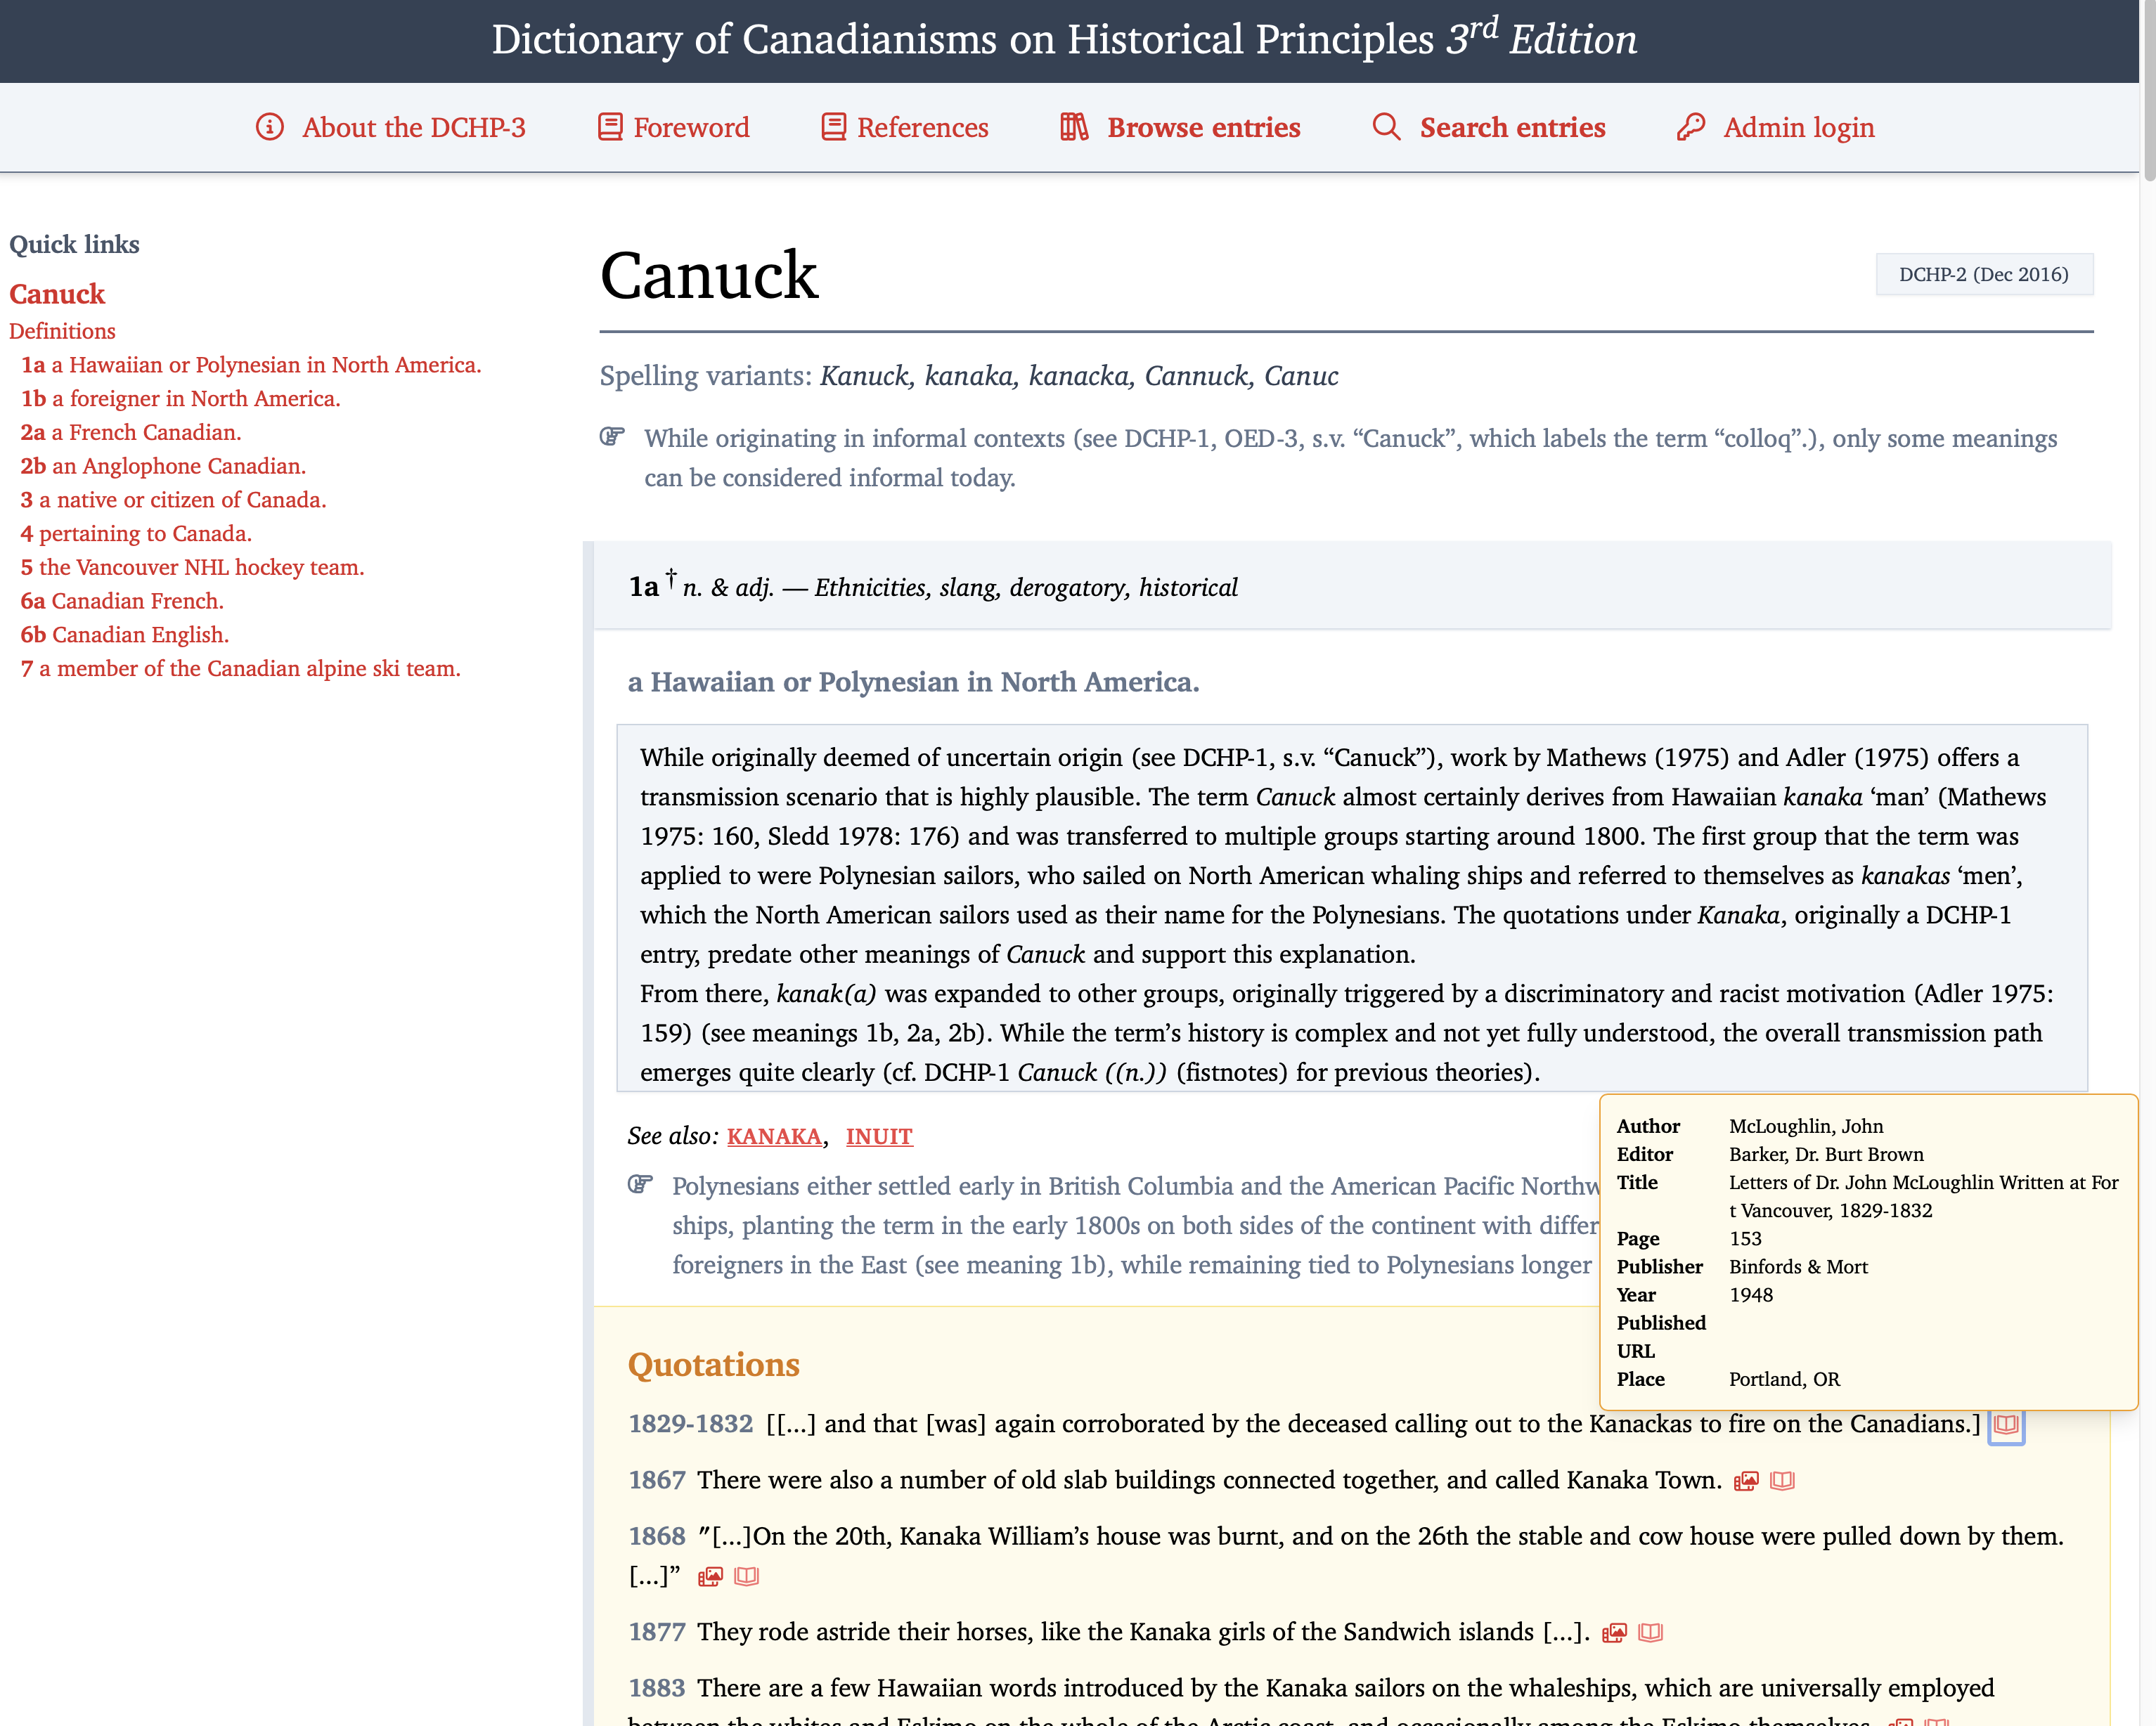
Full-stack rebuild of the Dictionary of Canadianisms on Historical Principles, a project of Professor Stefan Dollinger at UBC. Currently under development.

API design
Data wrangling
Development
Visual design

Technologies

Docker
MySQL
Prisma
React

Mass Timber Navigator Tool

OPEN Technologies View in new tab

Mass Timber Navigator Tool

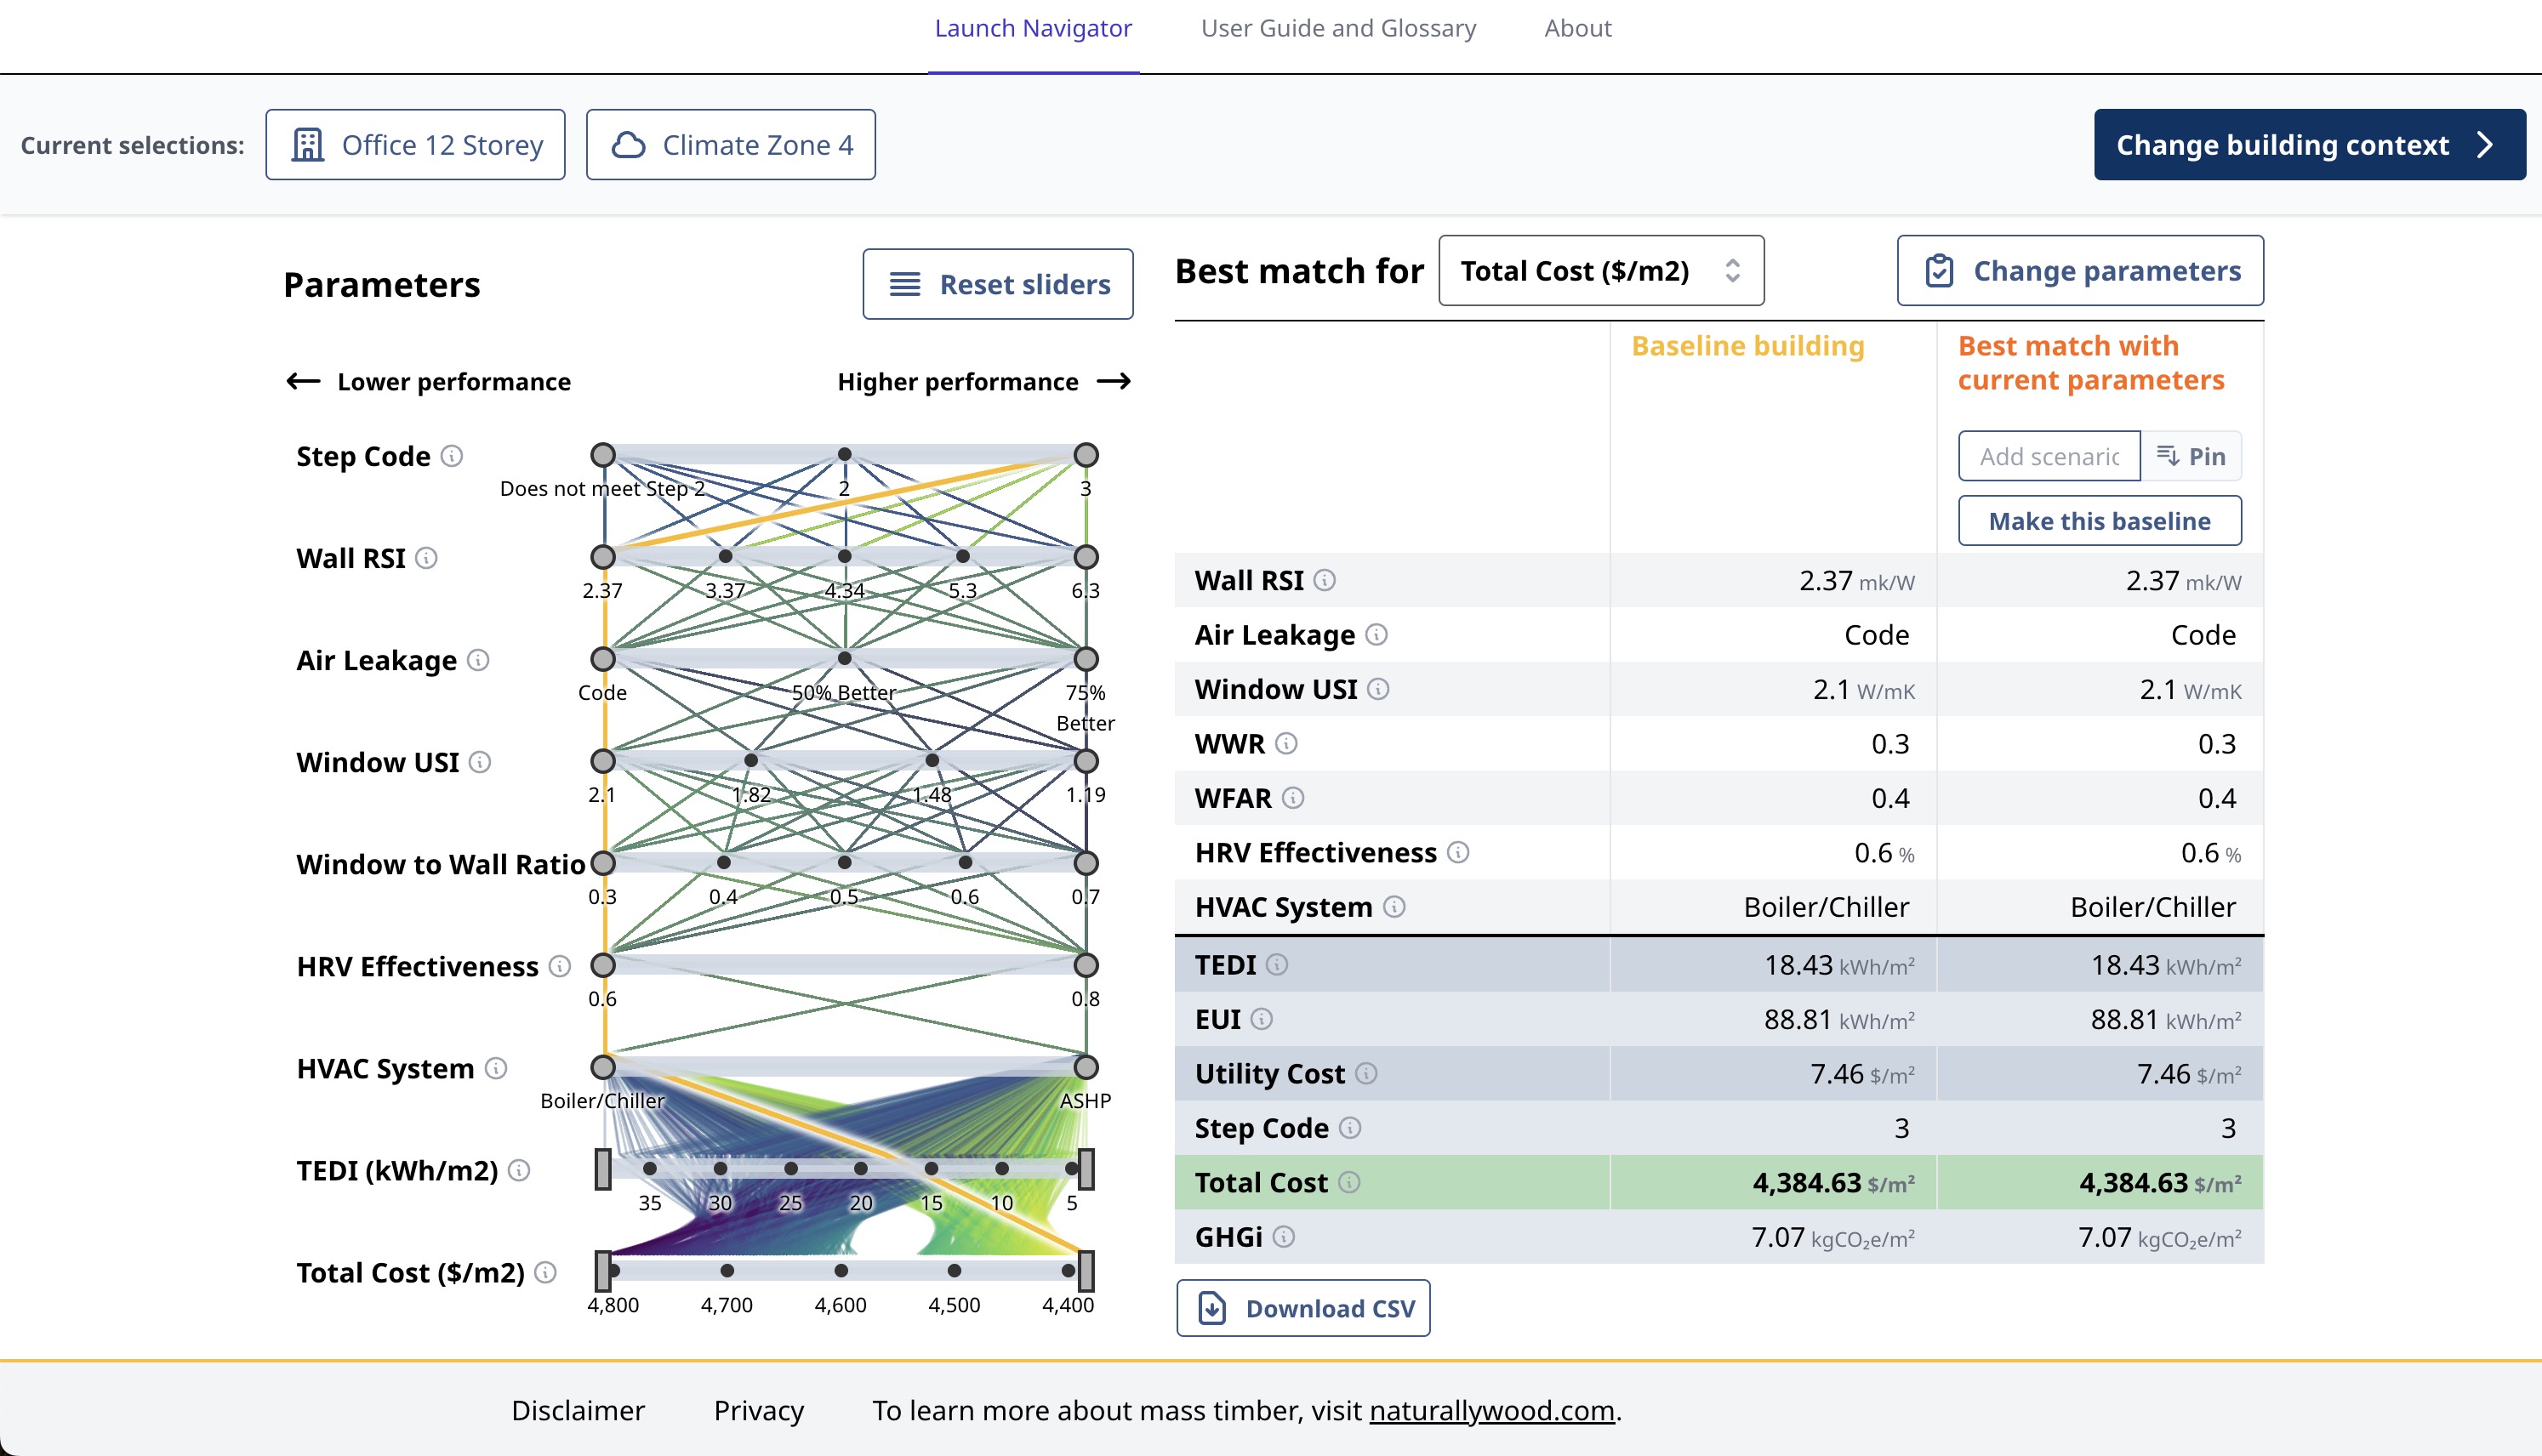
An interactive tool allowing users to model energy use of mass timber construction.

Charting
Development
Visual design

Technologies

D3
React

Client Self-Serve Dashboards

Retail Zipline

Client Self-Serve Dashboards

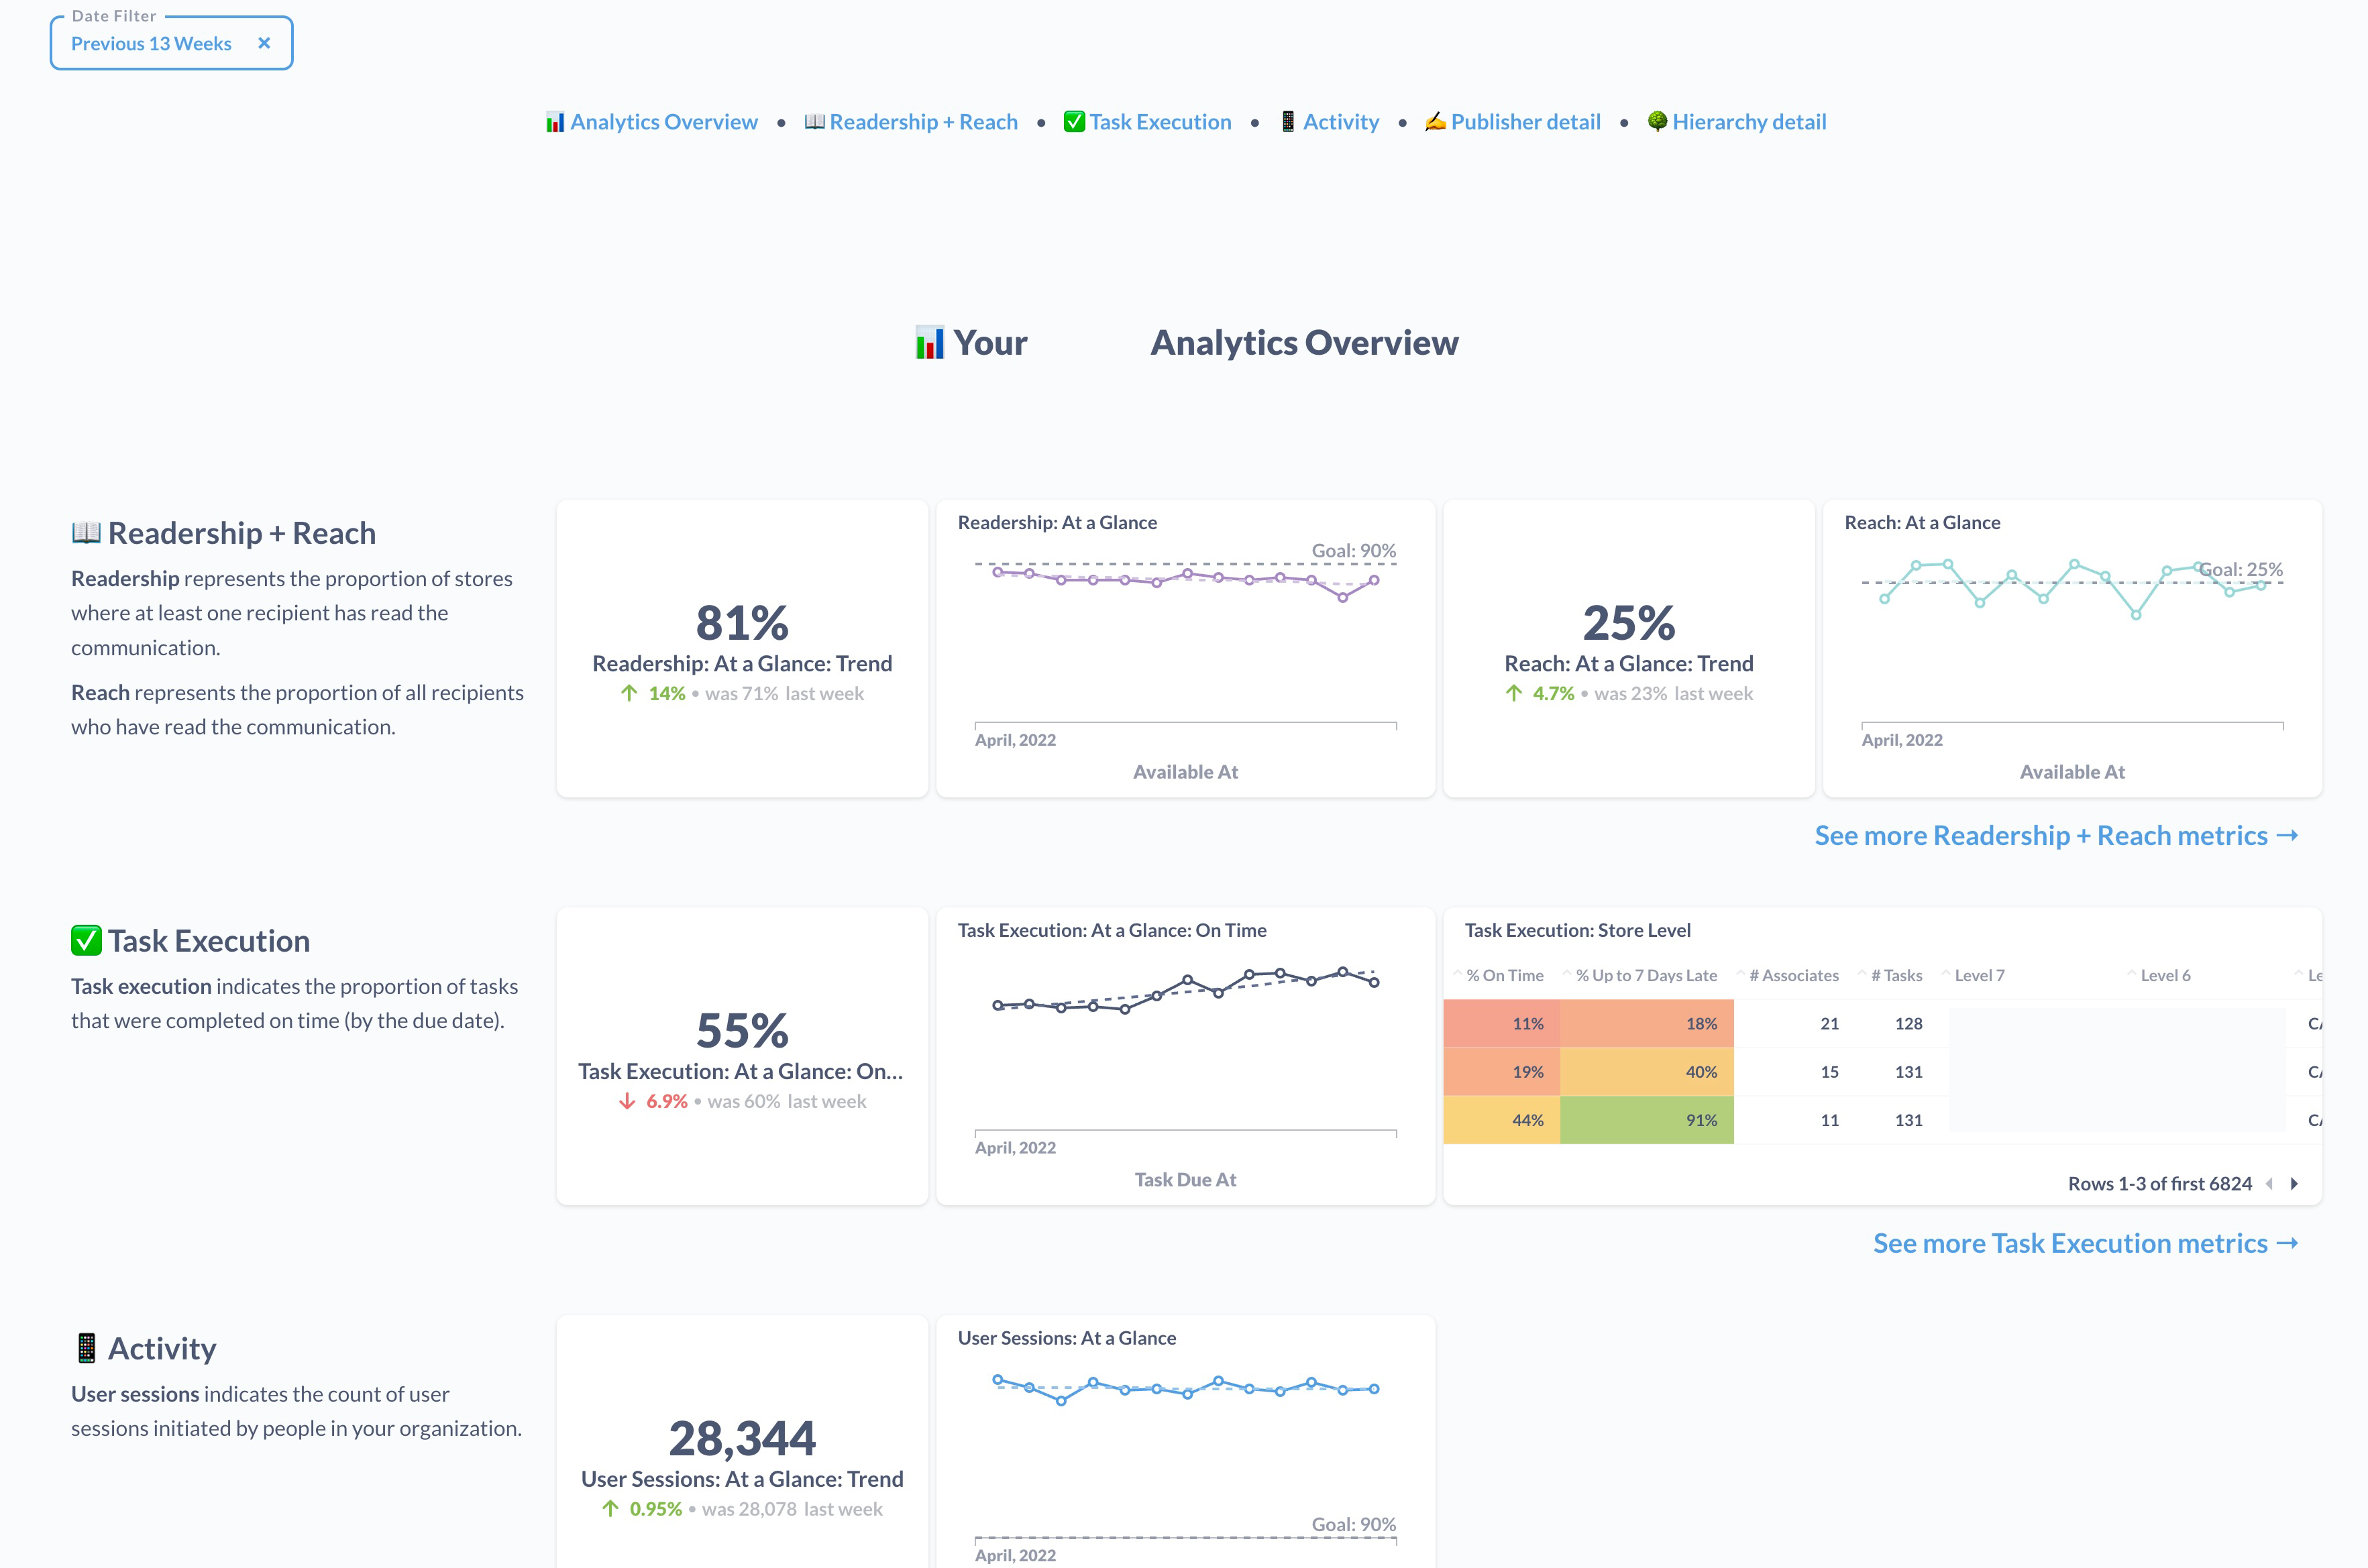
Dynamic reporting dashboards for customer analytics self-serve.

Analysis
Charting
Data wrangling
Visual design

Technologies

Google BigQuery
Metabase

Survey Admin Tools

BC Stats

Development of Exit Survey Admin and New Job Survey Admin internal reporting tools.

API design
Data wrangling
Development
Visual design

Technologies

.NET
OpenShift
Postgres
React

Workforce Profiles Tool

BC Stats View in new tab

Workforce Profiles Tool

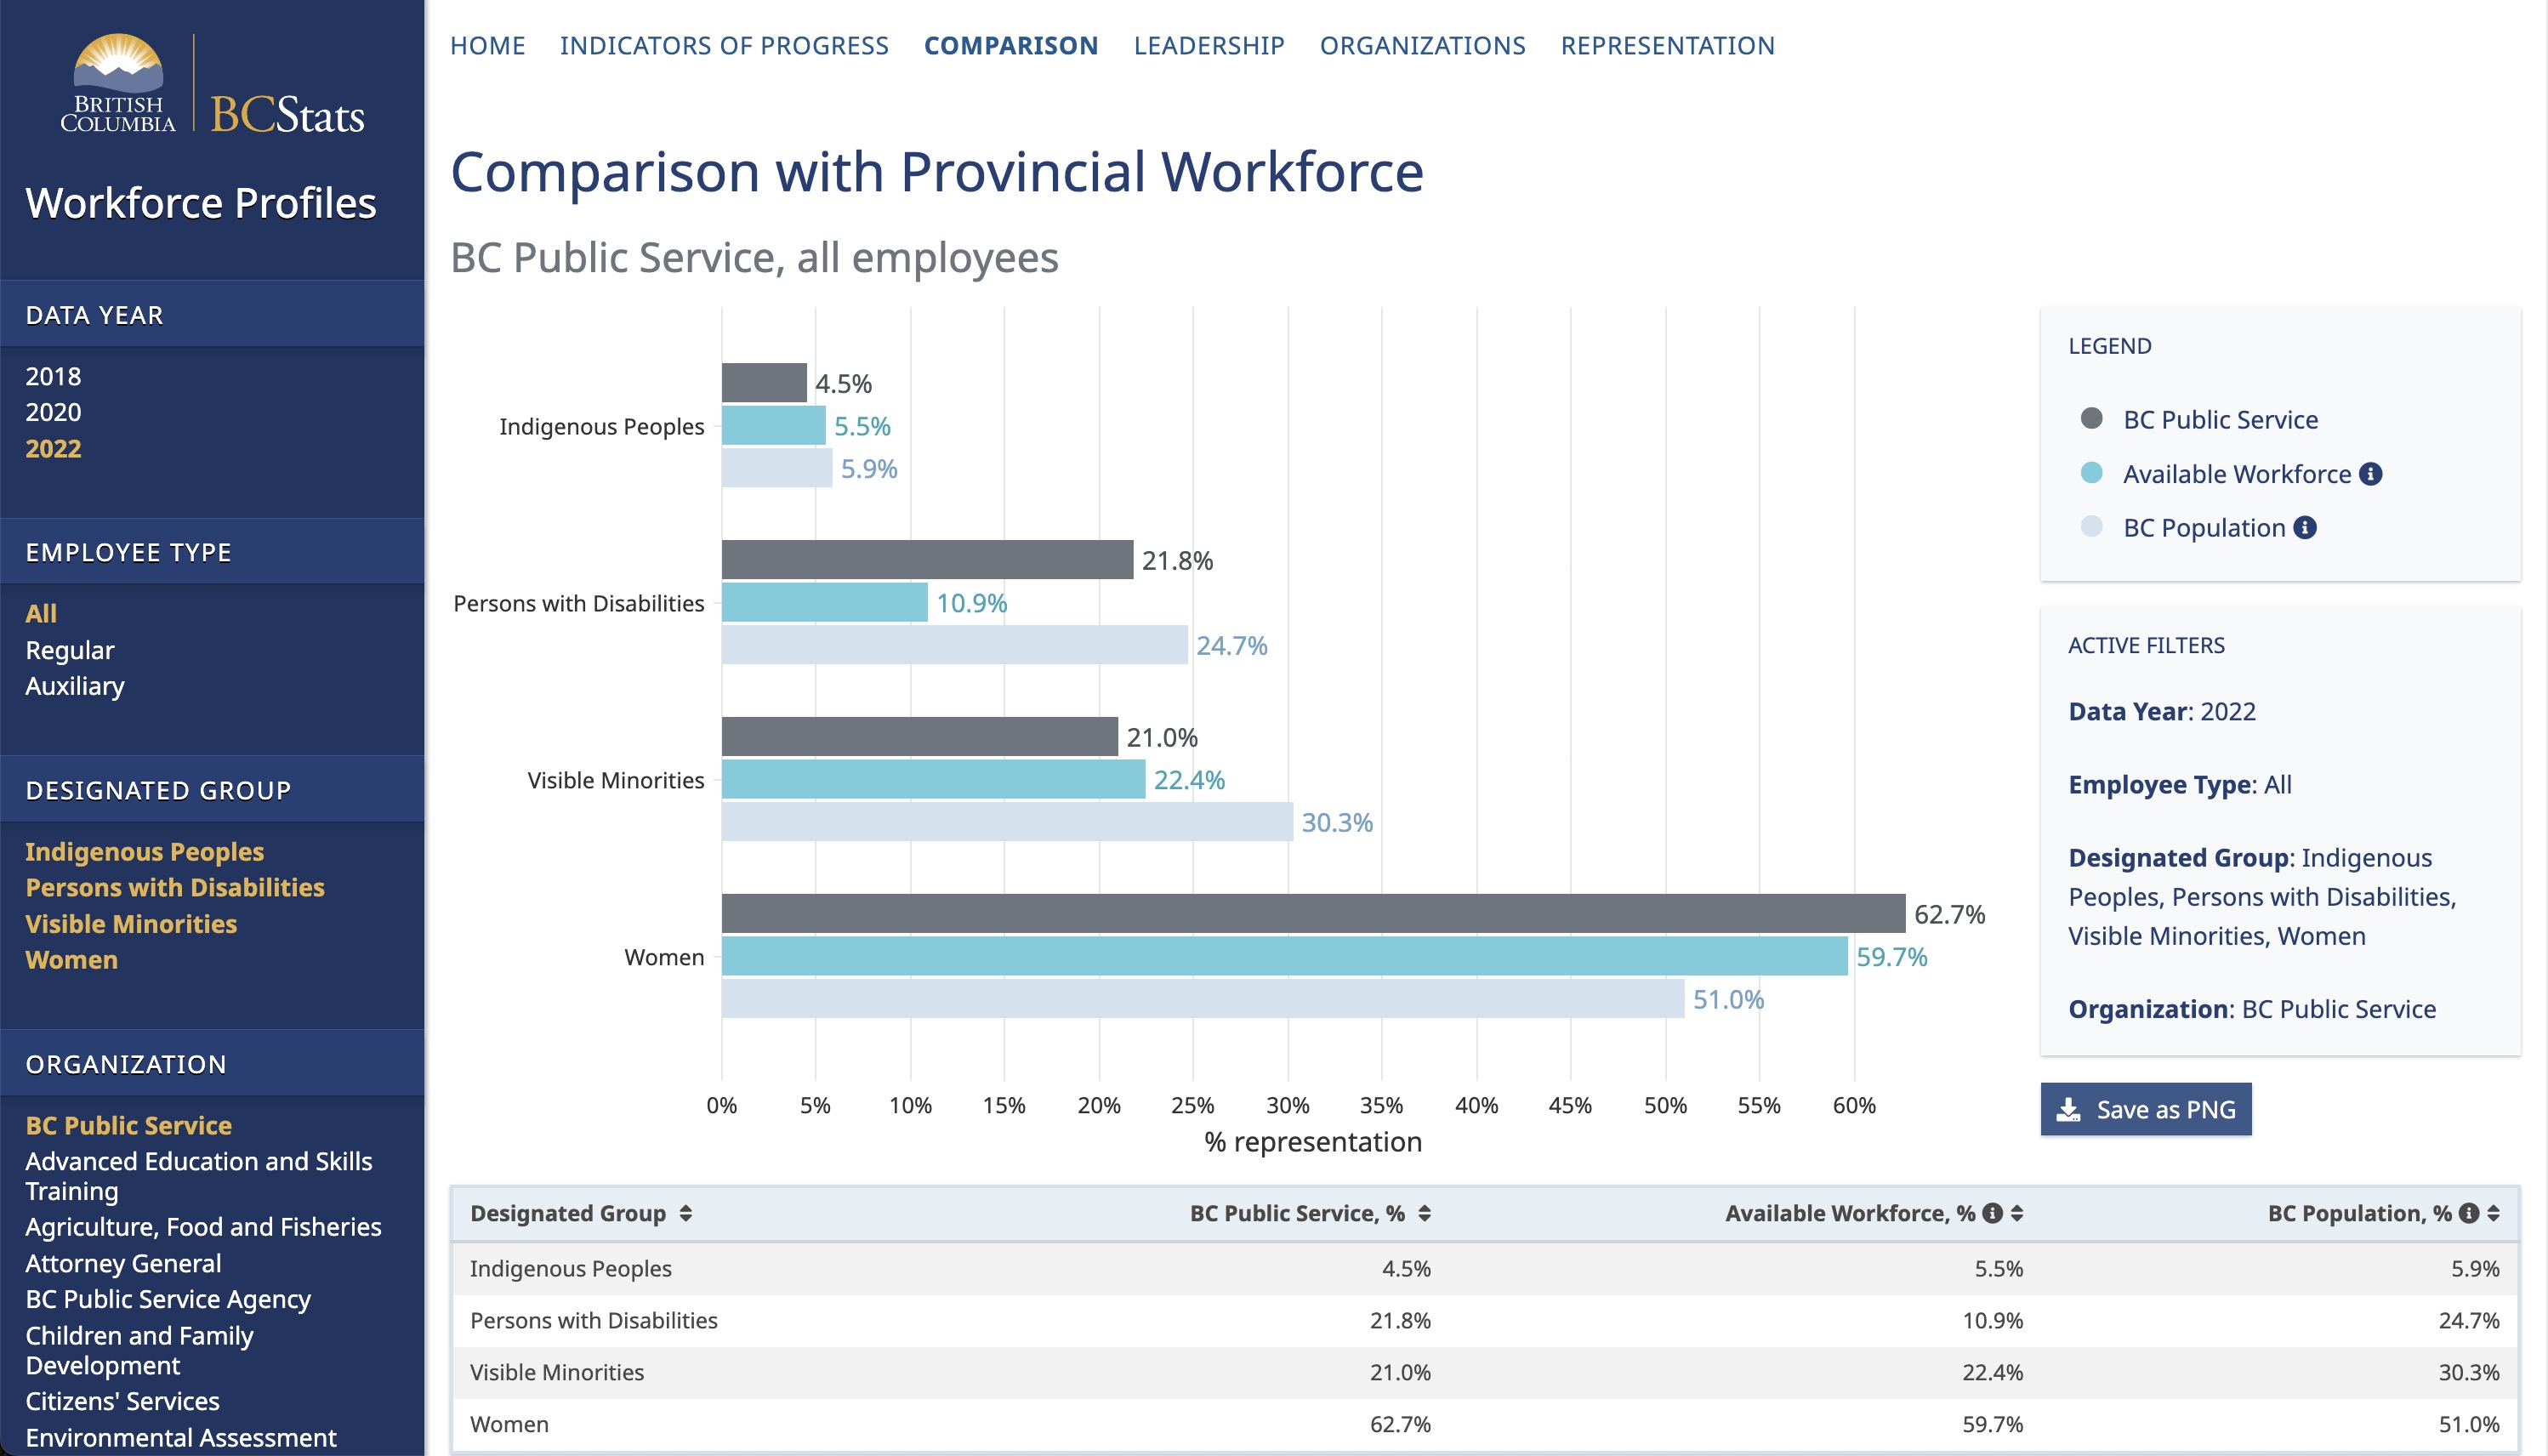
Workforce Profiles Report, providing public, interactive web-based visualization of demographics of various government ministries

Charting
Data wrangling
Development
Visual design

Technologies

D3
React

Rungh Redux

Rungh View in new tab

Rungh Redux

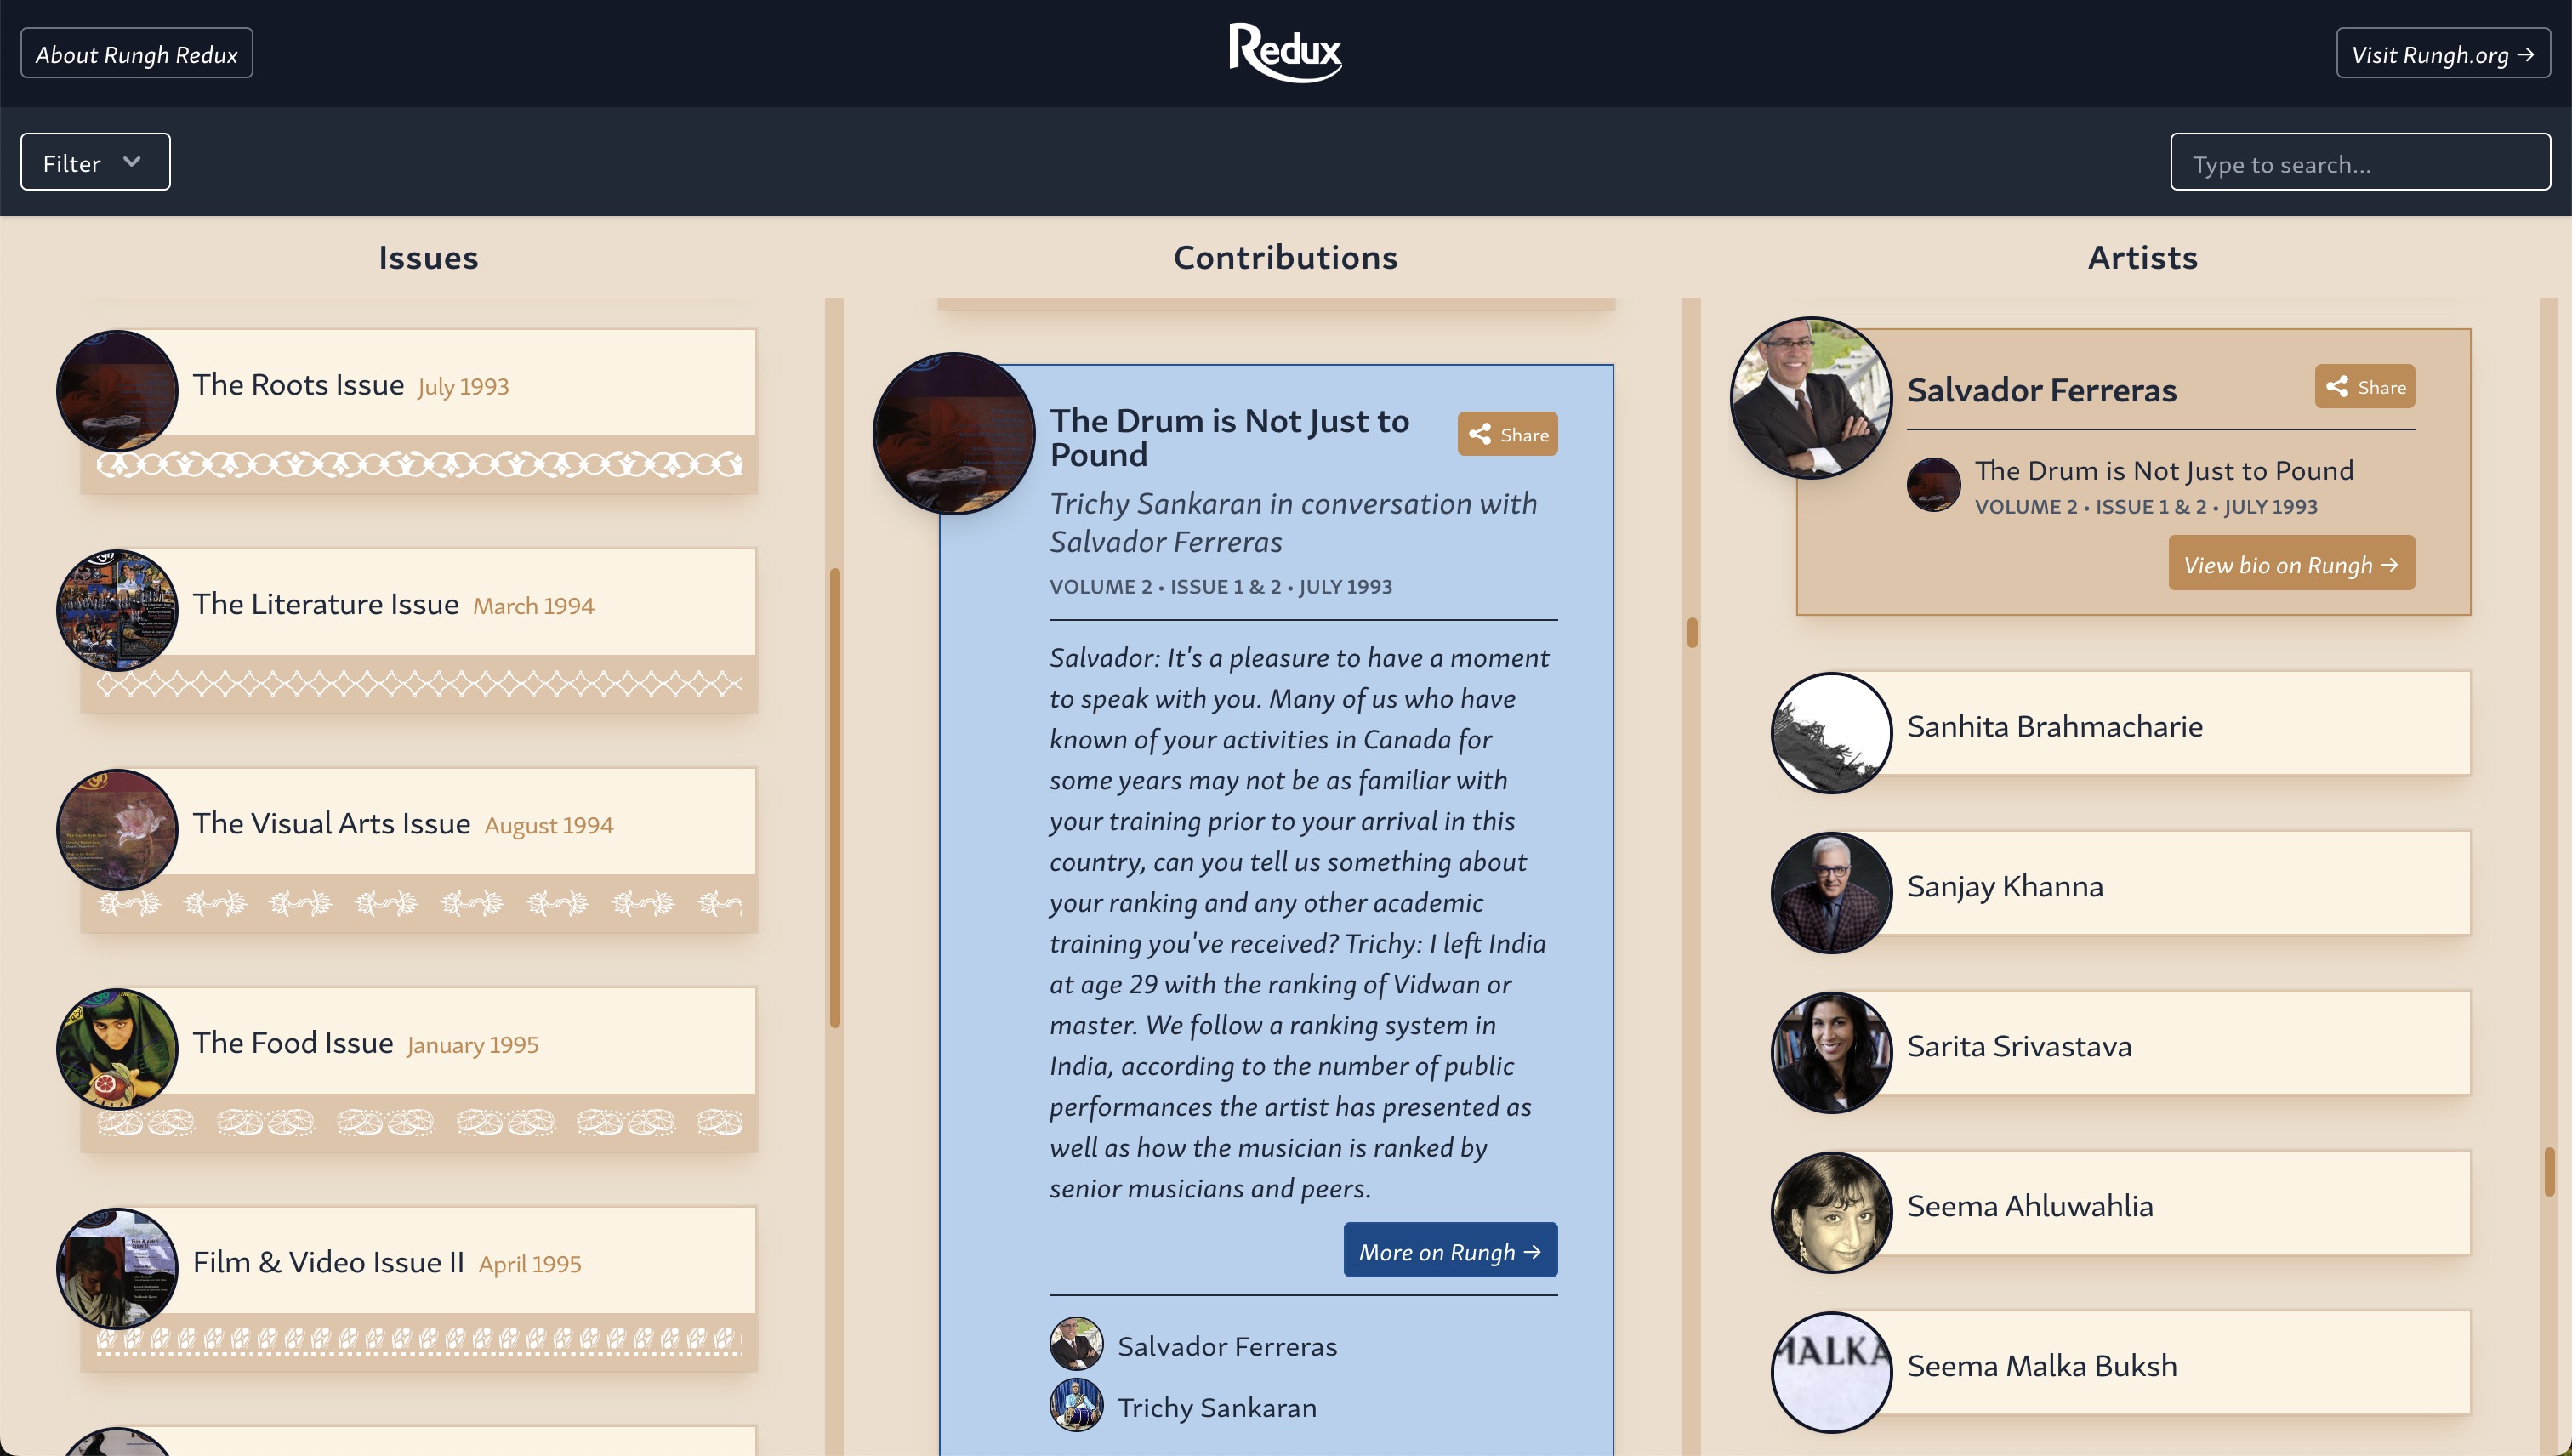
Rungh Redux, an interactive exploration of the history of Rungh magazine (Award of Merit, Innovative Practice, BC Museums Association)

API design
Data wrangling
Development
Visual design

Technologies

GraphQL
Hasura
Postgres
React

Pharmaceutical Data Visualizations

Broadstreet HEOR

Pharmaceutical Data Visualizations

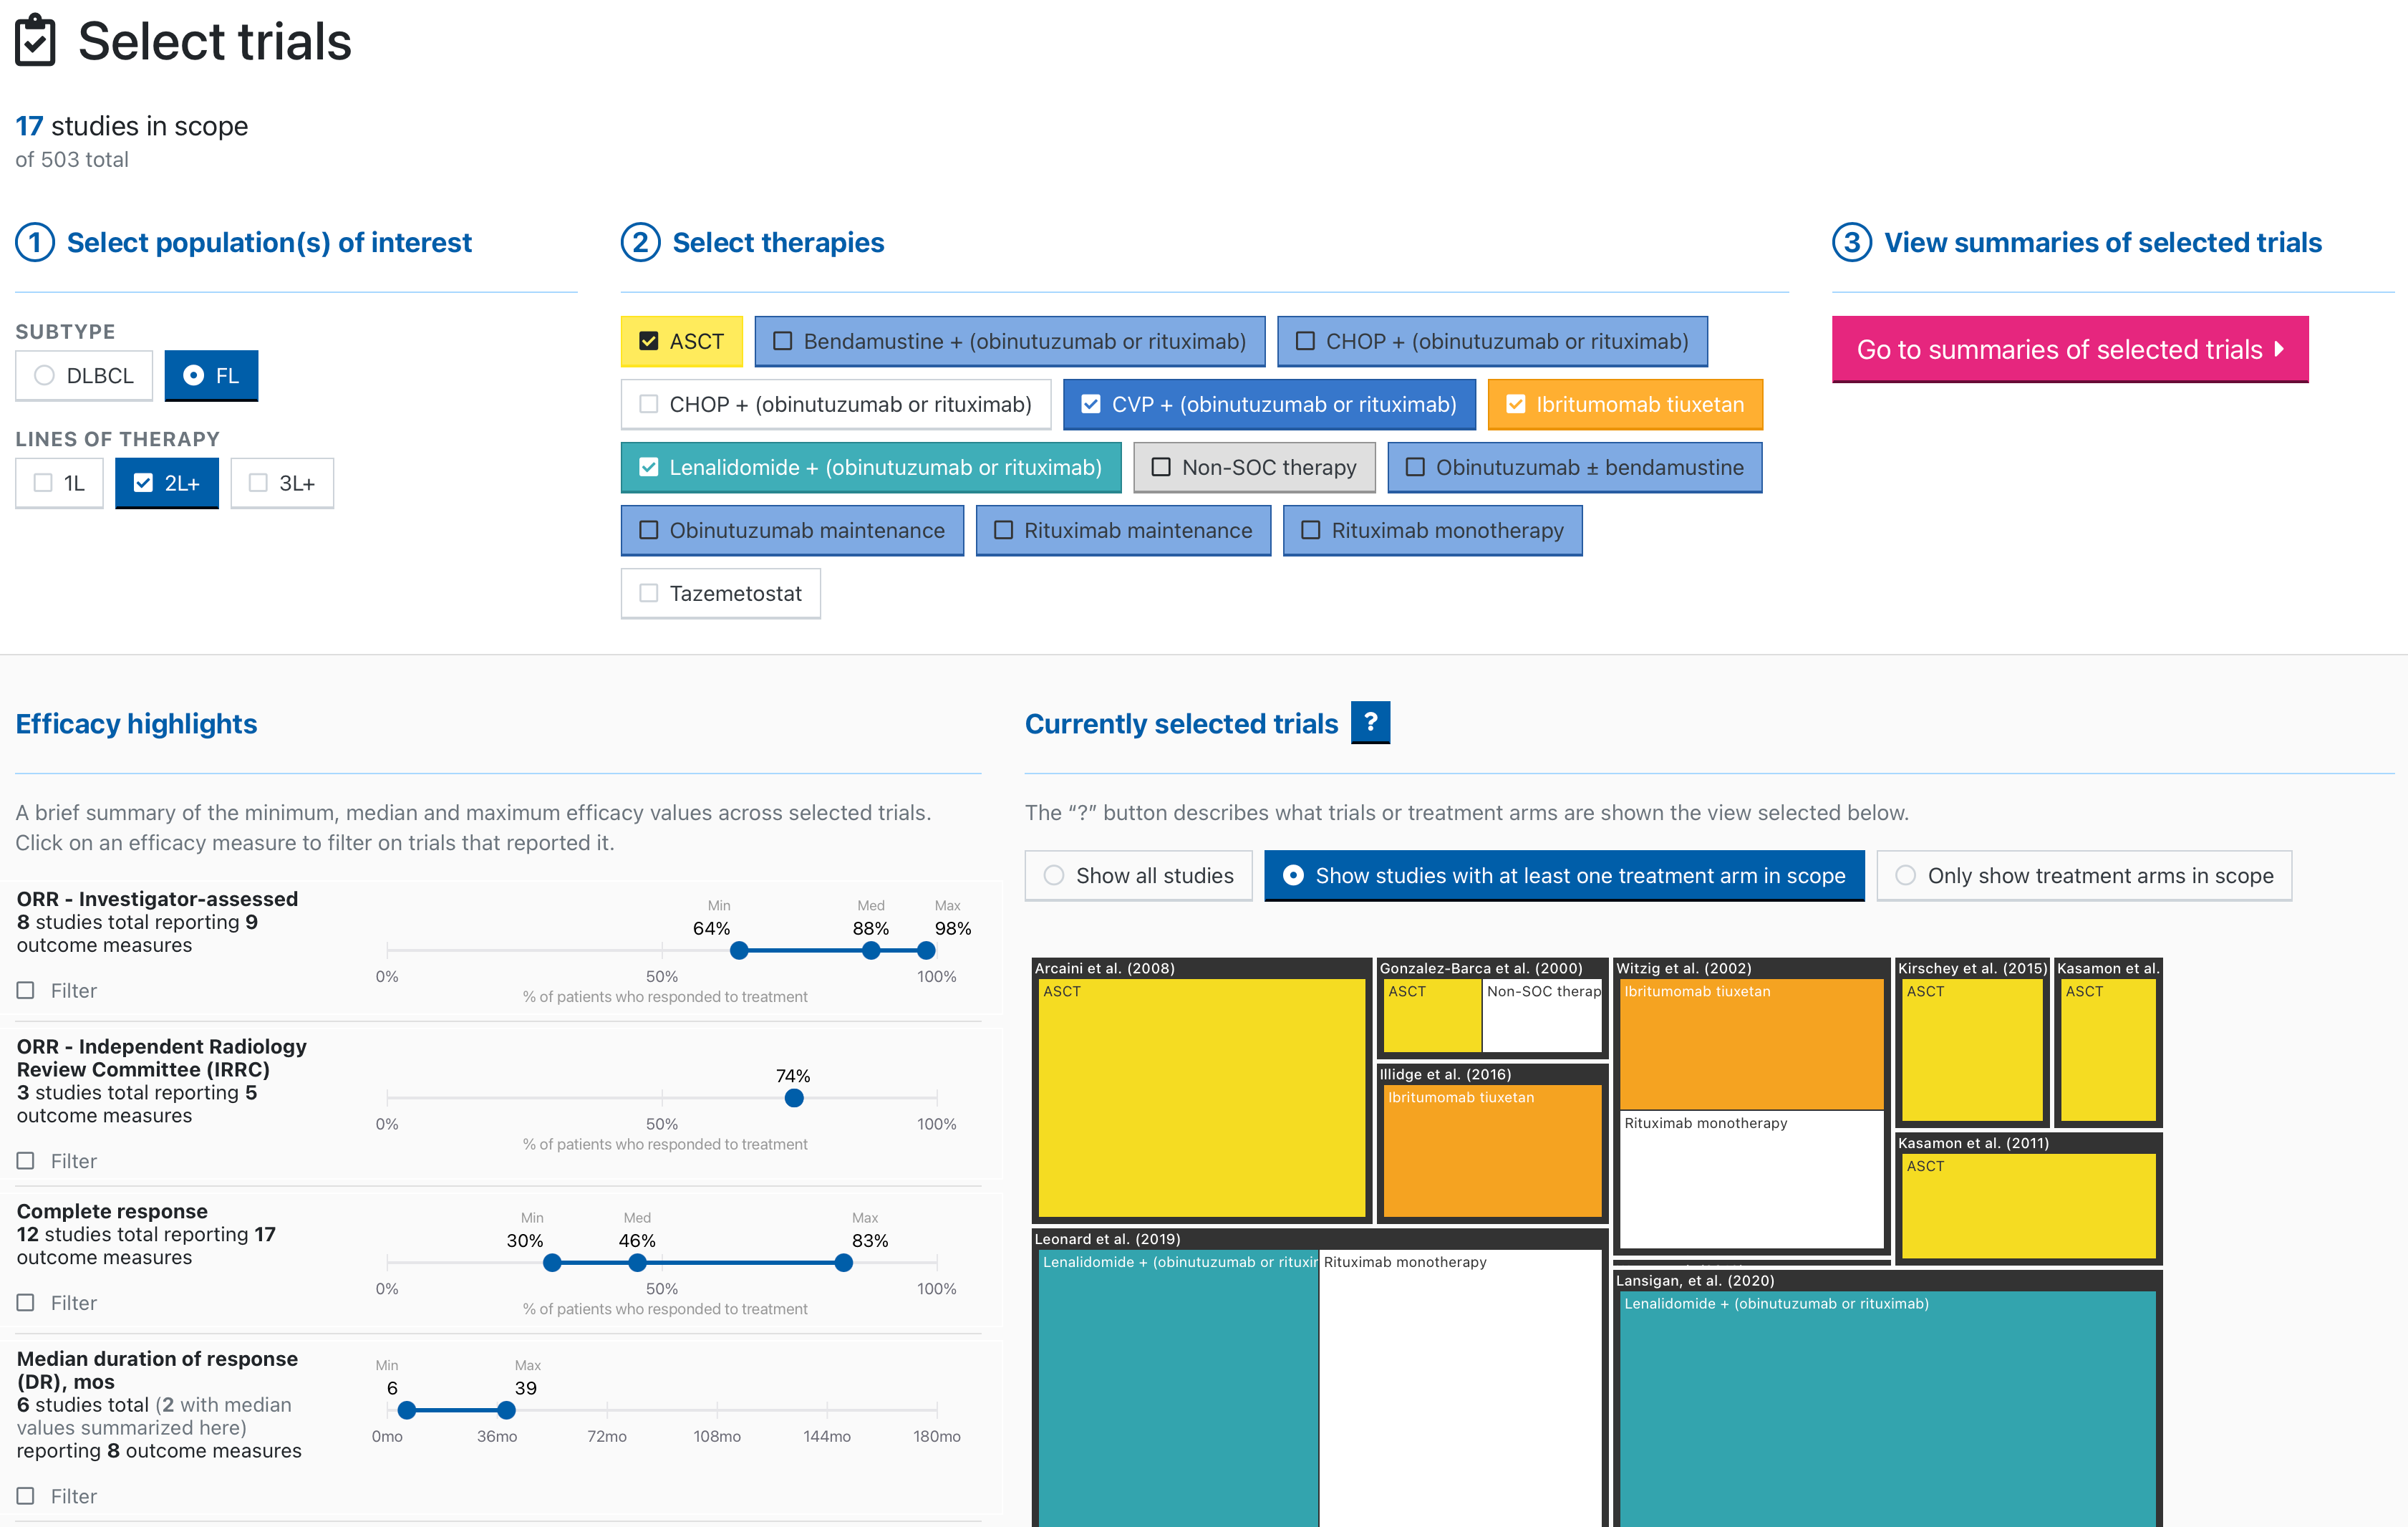
Custom web visualizations and explorations of pharmaceutical studies and outcomes.

Charting
Data wrangling
Development
Visual design

Technologies

D3
React

Margins of Error in the BC Election

Plot + Scatter View in new tab

Margins of Error in the BC Election

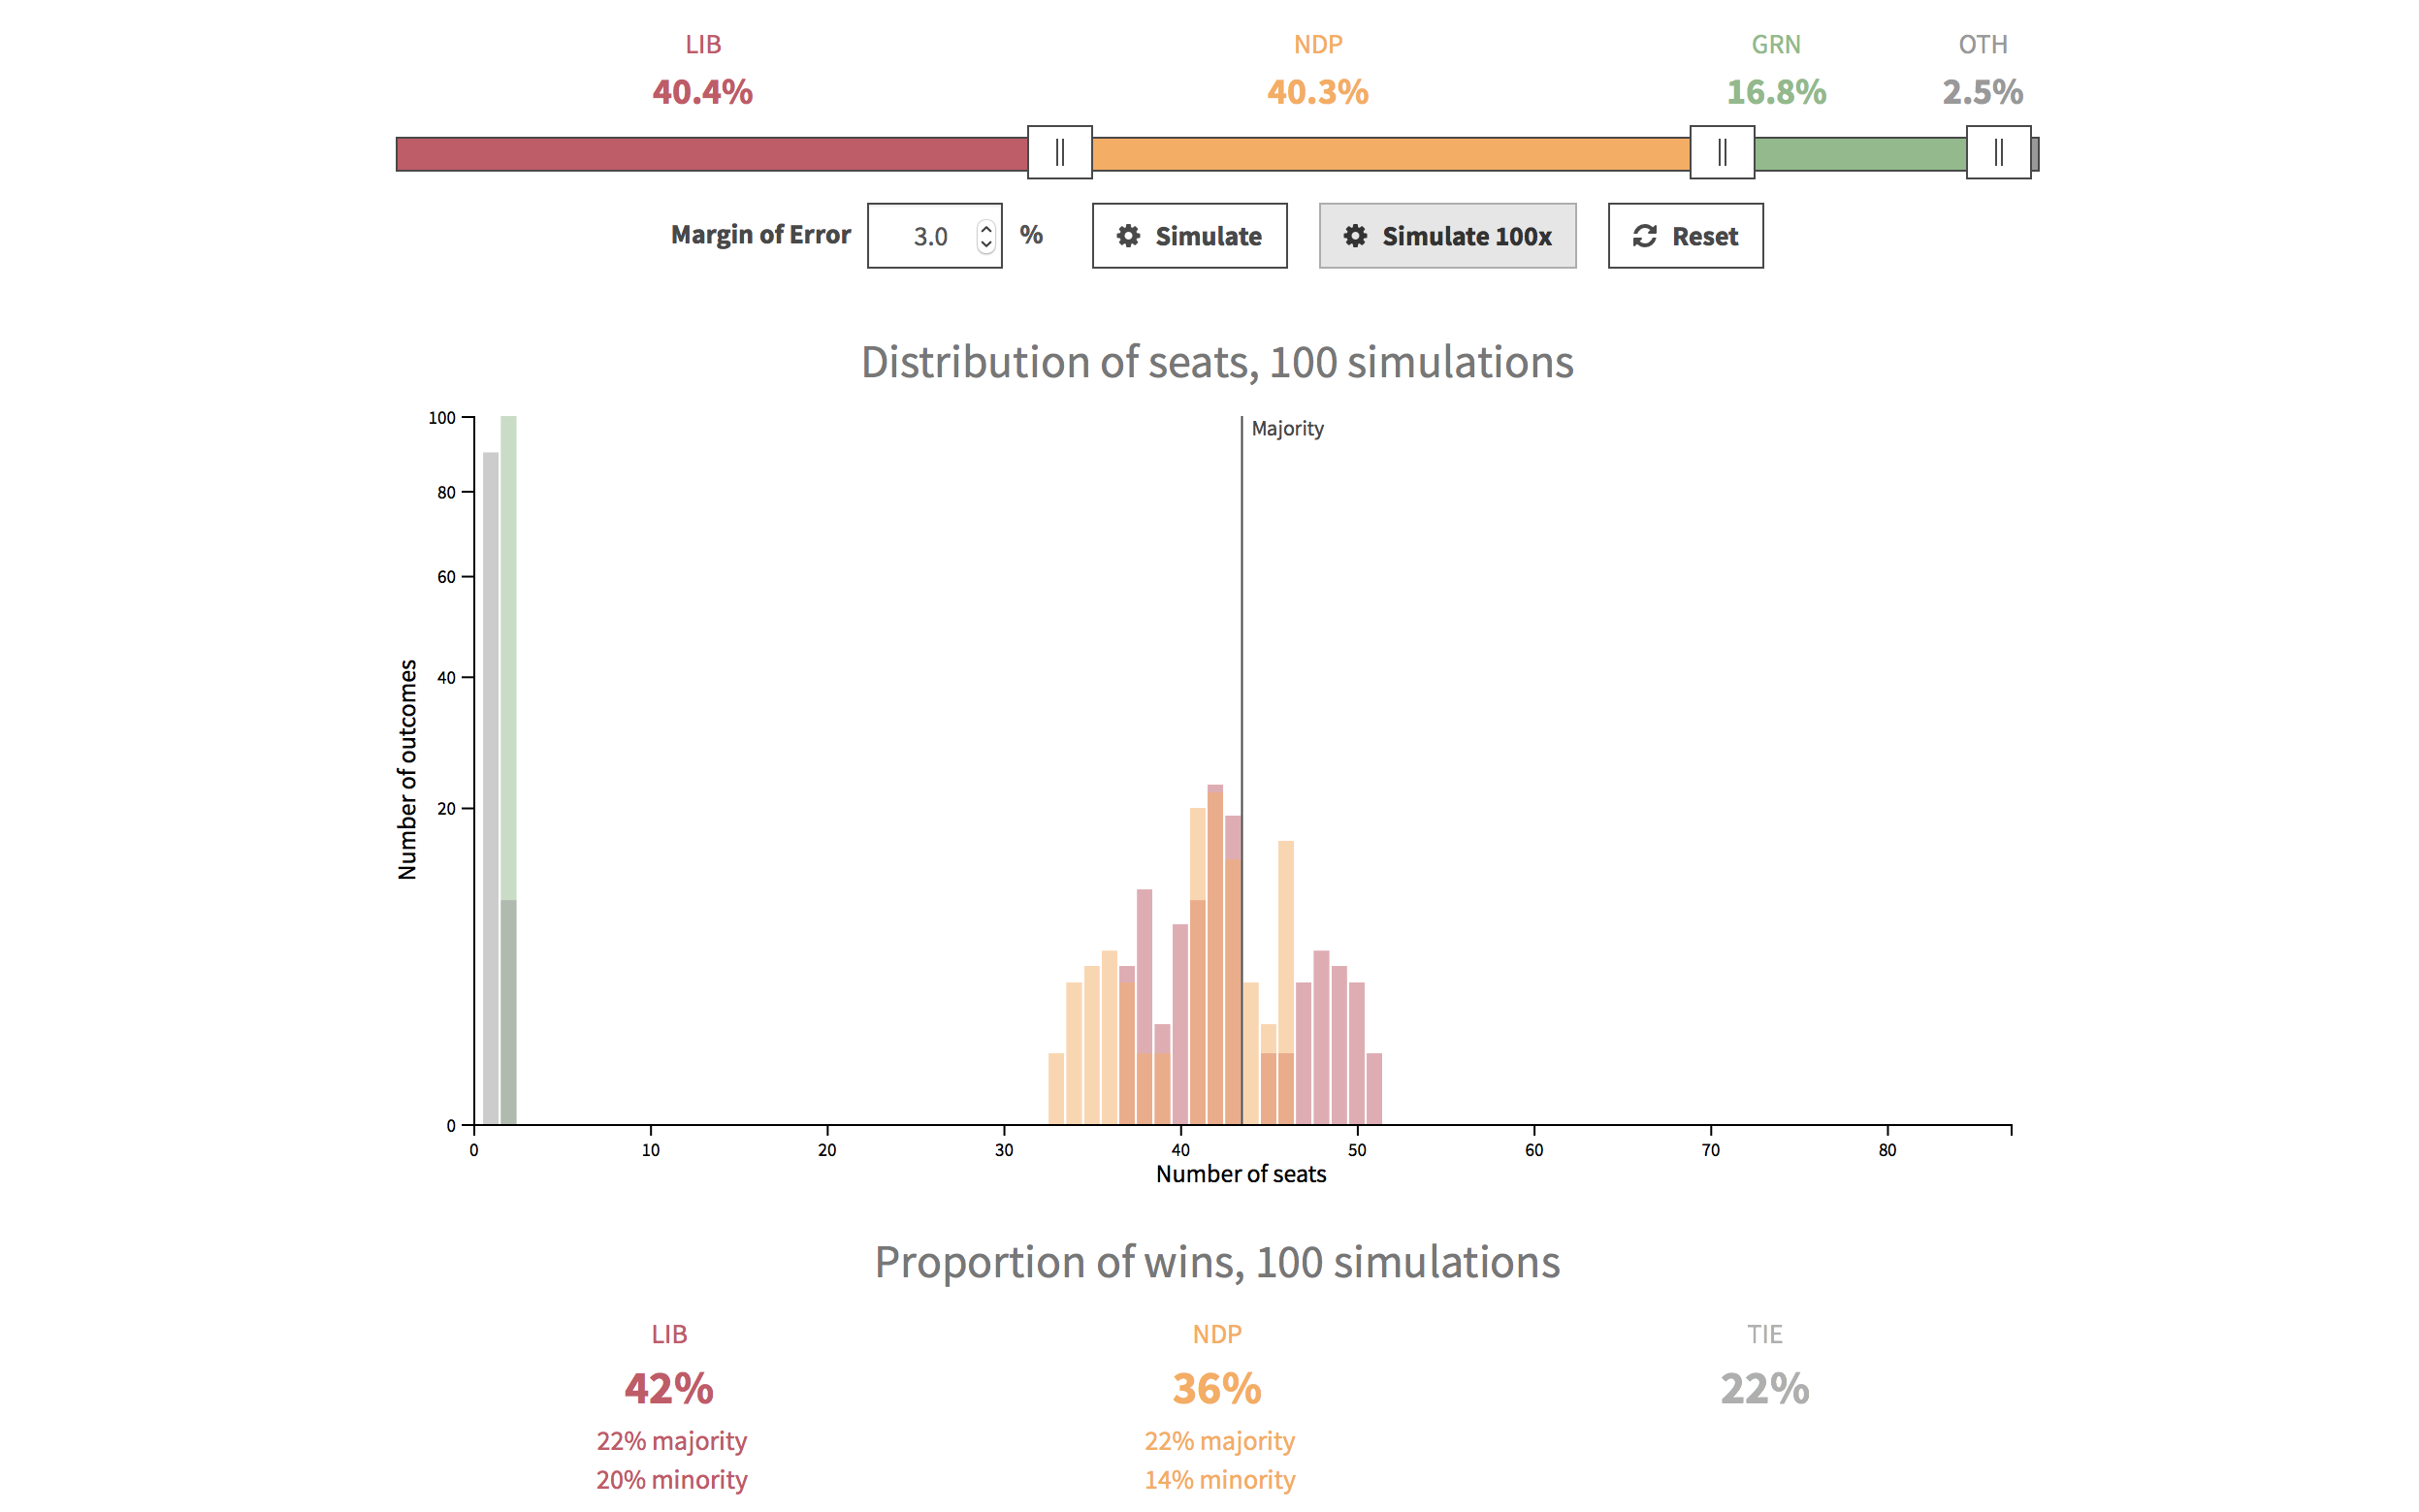
We built a tool to help visualize margins of error in political polling, using the 2017 BC Election as an example.

Charting
Data wrangling
Development
Visual design

Technologies

D3
React
Plot + Scatter logoPlot + Scatter
Vancouver, Canada
+1 778 871 9661
Data for human consumption.